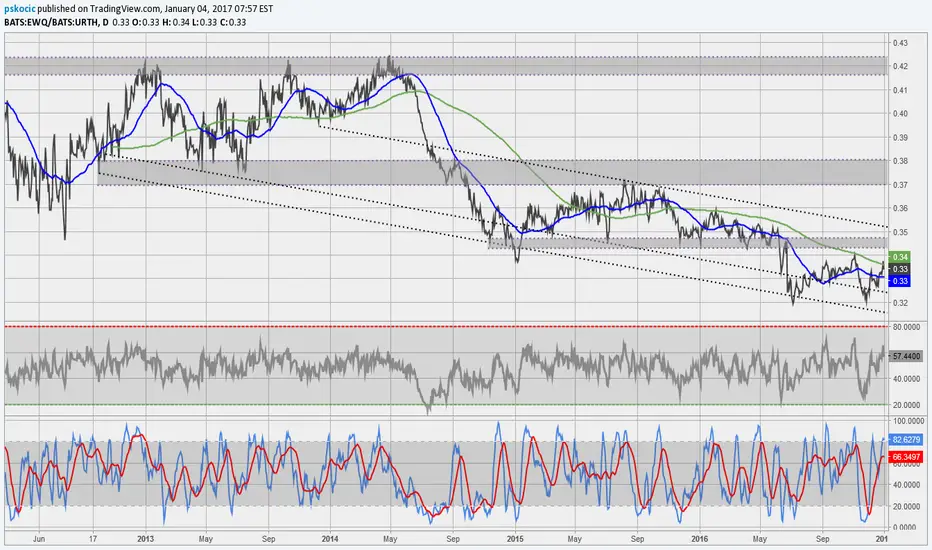
EWQ , Observations , Short holdings at 64% ( France ETF )
Still theme of increasing shorts as price accelerates . If we see EWQ breakout above its bear channel what will happen will shorts continue to increase even then ? This is bullish for me and the Dow net short positions are also up one percent at time of writing .
A breakout above channel will pro
Key stats
About iShares MSCI France Index Fund
Home page
Inception date
Mar 12, 1996
Structure
Open-Ended Fund
Replication method
Physical
Dividend treatment
Distributes
Distribution tax treatment
Qualified dividends
Income tax type
Capital Gains
Max ST capital gains rate
39.60%
Max LT capital gains rate
20.00%
Primary advisor
BlackRock Fund Advisors
Distributor
BlackRock Investments LLC
EWQ captures broad French equities, holding a diverse portfolio of French large- and mid-caps with market-like array of sector weights. The French index covers securities, as classified by MSCIs country classification, traded on the Paris Stock Exchange. Since EWQ is made of French stocks, North American traders will get the best execution in the morning when the markets overlap. The fund typically engages in securities lending, which brings revenues to the fund at the cost of slight counterparty risk. The index is reviewed quarterly, starting every February with semi-annual index reviews in May and November.
Related funds
Classification
What's in the fund
Exposure type
Consumer Non-Durables
Electronic Technology
Finance
Producer Manufacturing
Health Technology
Stock breakdown by region
Top 10 holdings


Summarizing what the indicators are suggesting.
Oscillators
Neutral
SellBuy
Strong sellStrong buy
Strong sellSellNeutralBuyStrong buy
Oscillators
Neutral
SellBuy
Strong sellStrong buy
Strong sellSellNeutralBuyStrong buy
Summary
Neutral
SellBuy
Strong sellStrong buy
Strong sellSellNeutralBuyStrong buy
Summary
Neutral
SellBuy
Strong sellStrong buy
Strong sellSellNeutralBuyStrong buy
Summary
Neutral
SellBuy
Strong sellStrong buy
Strong sellSellNeutralBuyStrong buy
Moving Averages
Neutral
SellBuy
Strong sellStrong buy
Strong sellSellNeutralBuyStrong buy
Moving Averages
Neutral
SellBuy
Strong sellStrong buy
Strong sellSellNeutralBuyStrong buy
Displays a symbol's price movements over previous years to identify recurring trends.
Frequently Asked Questions
An exchange-traded fund (ETF) is a collection of assets (stocks, bonds, commodities, etc.) that track an underlying index and can be bought on an exchange like individual stocks.
EWQ trades at 43.72 USD today, its price has risen 0.74% in the past 24 hours. Track more dynamics on EWQ price chart.
EWQ net asset value is 43.70 today — it's risen 4.09% over the past month. NAV represents the total value of the fund's assets less liabilities and serves as a gauge of the fund's performance.
EWQ assets under management is 390.53 M USD. AUM is an important metric as it reflects the fund's size and can serve as a gauge of how successful the fund is in attracting investors, which, in its turn, can influence decision-making.
EWQ price has risen by 4.67% over the last month, and its yearly performance shows a 15.54% increase. See more dynamics on EWQ price chart.
NAV returns, another gauge of an ETF dynamics, have risen by 4.09% over the last month, showed a 9.34% increase in three-month performance and has increased by 18.28% in a year.
NAV returns, another gauge of an ETF dynamics, have risen by 4.09% over the last month, showed a 9.34% increase in three-month performance and has increased by 18.28% in a year.
EWQ fund flows account for −295.22 M USD (1 year). Many traders use this metric to get insight into investors' sentiment and evaluate whether it's time to buy or sell the fund.
Since ETFs work like an individual stock, they can be bought and sold on exchanges (e.g. NASDAQ, NYSE, EURONEXT). As it happens with stocks, you need to select a brokerage to access trading. Explore our list of available brokers to find the one to help execute your strategies. Don't forget to do your research before getting to trading. Explore ETFs metrics in our ETF screener to find a reliable opportunity.
EWQ invests in stocks. See more details in our Analysis section.
EWQ expense ratio is 0.50%. It's an important metric for helping traders understand the fund's operating costs relative to assets and how expensive it would be to hold the fund.
No, EWQ isn't leveraged, meaning it doesn't use borrowings or financial derivatives to magnify the performance of the underlying assets or index it follows.
In some ways, ETFs are safe investments, but in a broader sense, they're not safer than any other asset, so it's crucial to analyze a fund before investing. But if your research gives a vague answer, you can always refer to technical analysis.
Today, EWQ technical analysis shows the buy rating and its 1-week rating is strong buy. Since market conditions are prone to changes, it's worth looking a bit further into the future — according to the 1-month rating EWQ shows the buy signal. See more of EWQ technicals for a more comprehensive analysis.
Today, EWQ technical analysis shows the buy rating and its 1-week rating is strong buy. Since market conditions are prone to changes, it's worth looking a bit further into the future — according to the 1-month rating EWQ shows the buy signal. See more of EWQ technicals for a more comprehensive analysis.
Yes, EWQ pays dividends to its holders with the dividend yield of 2.82%.
EWQ trades at a premium (0.06%).
Premium/discount to NAV expresses the difference between the ETF’s price and its NAV value. A positive percentage indicates a premium, meaning the ETF trades at a higher price than the calculated NAV. Conversely, a negative percentage indicates a discount, suggesting the ETF trades at a lower price than NAV.
Premium/discount to NAV expresses the difference between the ETF’s price and its NAV value. A positive percentage indicates a premium, meaning the ETF trades at a higher price than the calculated NAV. Conversely, a negative percentage indicates a discount, suggesting the ETF trades at a lower price than NAV.
EWQ shares are issued by BlackRock, Inc.
EWQ follows the MSCI France. ETFs usually track some benchmark seeking to replicate its performance and guide asset selection and objectives.
The fund started trading on Mar 12, 1996.
The fund's management style is passive, meaning it's aiming to replicate the performance of the underlying index by holding assets in the same proportions as the index. The goal is to match the index's returns.