FAS looks to possibly be setting up for a few week bull runMy custom-coded indicators are pointing to a small bull run in financials over the next few weeks. I'm waiting for the green bar to turn grey, but my indicators are saying it's gonna happenLongby Strategic_Option_TradingUpdated 5
FAS - Swing Trade Short term CallsThis is for our aggressive portfolio. Watch how FAS fights to stay within its pattern. If FAS turns higher it is time to buy CALLS. 2 or 3 day hold MAX. If we break the channel to the downside, keep an eye out for PUTS. As I am writing this now the S&P Futures are lower. Wait and See. Be SMART AMEX:FASby trendingupinvestorUpdated 8
FAS BREAKOUTDaily strong buyers in up trend backed by increase of volume, making a breakoutLongby simtrader19aUpdated 5
FAS Long until end of dayFAS to follow up on TQQQ's performance through end of day todayLongby jfs2152224
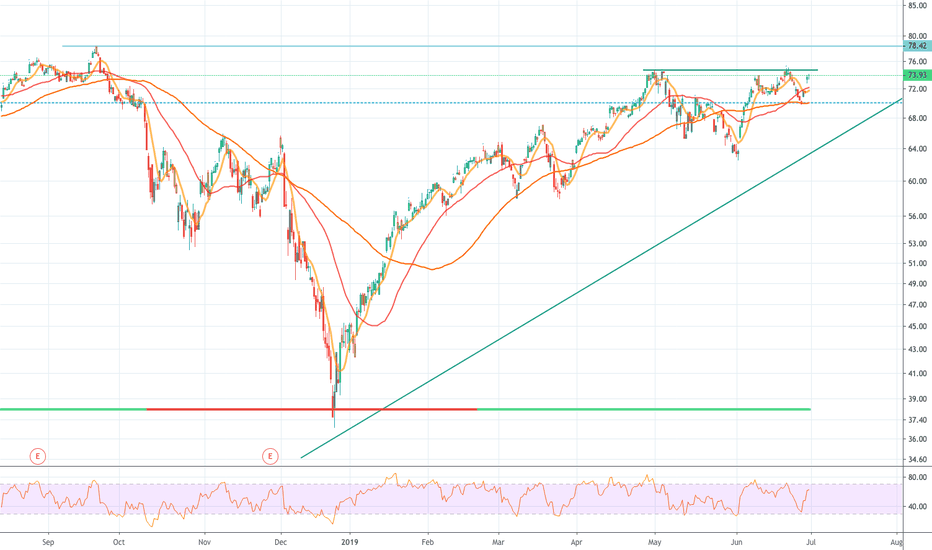
Financials Passing Overhead Resistance in Pre-marketA very bullish sign for the Financial sector when FAS passed the double top overhead resistance at around $74.93 in premarker trading. New resistance is at $78.42 which is good for a further 3.5%. Given the events of Saturday I expect this to continue marching forward. by DanjaZown1
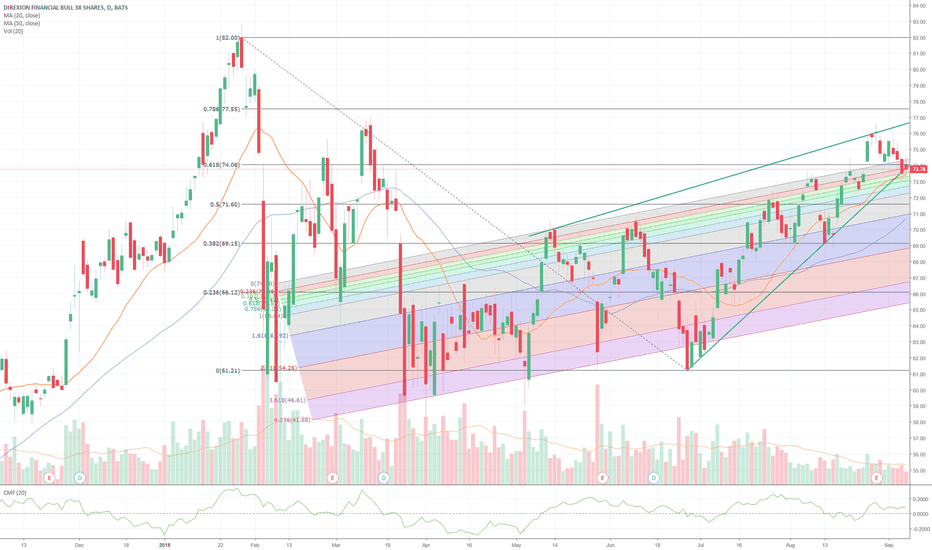
FAS Hitting 61.8% retrace on the dailyTomorrow, we will see if Bulls have what it takes to continue the momentum. by mixxo092
FASAnother stock I'm bullish on. Long a pullback, set conservative target at around 70.4, aggressive targets would be around 76 to 77.Longby bigledgepapi0
FAS WedgeTrying to decide which way it will break..... I think to the upside, but it is also looking pretty weak as well. Any thoughts?by speedstocks1
Crawled and ready to move onBanks are going to run hugher since oil inventories are starting to fallLongby showerreportUpdated 6
long FAS (3x bull ETF: XLF)long over 72.80 here on a break out in price $XLF $FAS $FAZ $TTFSLongby chaching231
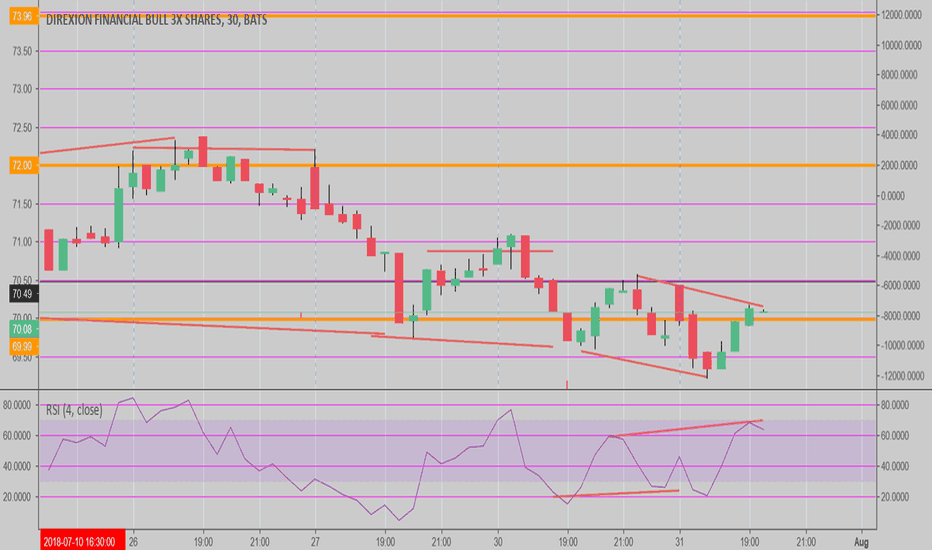
FAS Sell 69.80 TP 68.05 SL 70.05 RR 6 Hidden divergenceHIdden divergence on 30, 60, 90 min chartShortby rph27501
FAS Buy 70.85 stp, TP 72.10, SL 69.74Hidden divergence on three time periods. Price unchanged, but RSI divergence down in an up trend and just coming off support -> buy signal. TP 72.10, but could go higher RR = 1.25 Shorter TP, could have entered Friday about 90 minutes before close, with better RR. Back testing shows RR 1.25 to 2.0 with entries 3-4X/week. Only check chart 3 times a day with this method. Longby rph27501
$FAS Still pretty mute, not participating. They are coming for it no worries. Longby nelsnycUpdated 1
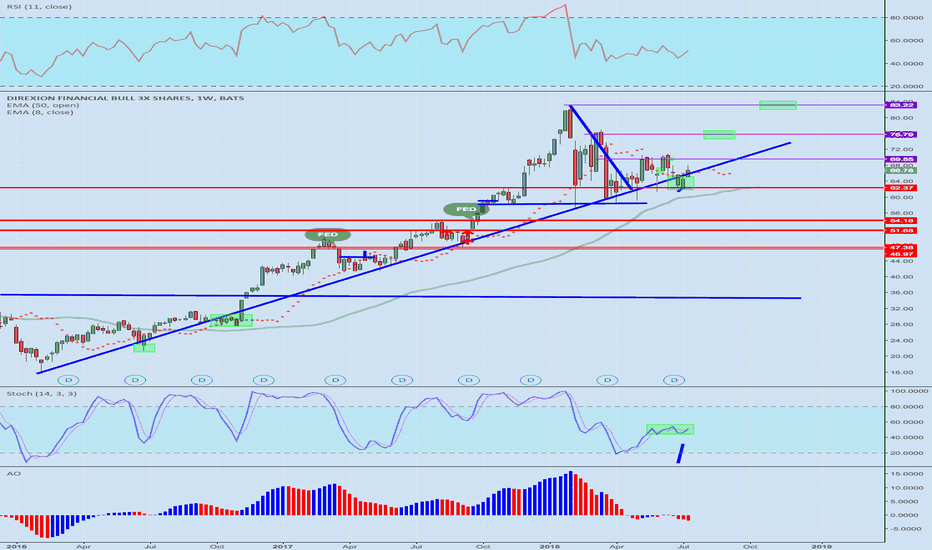
FAS neutral until 1 week before FOMCExpect FAS to fall further (hold a range between 60/62.5) until a week before the FOMC meeting and then break out the triangle ro bull by showerreport2