FENY - MSCI EnergyI am 80% bullish on the Energy ETF (FENY). I am planning to fill my position for August 2024 at $25.10.
I allocate a portion of my monthly salary to invest in ETFs. Currently, my position is with SPUS (S&P 500), but given the current bearish market for S&P's, FENY is my next best option for small c
Key stats
About Fidelity MSCI Energy Index ETF
Home page
Inception date
Oct 21, 2013
Structure
Open-Ended Fund
Replication method
Physical
Dividend treatment
Distributes
Distribution tax treatment
Qualified dividends
Income tax type
Capital Gains
Max ST capital gains rate
39.60%
Max LT capital gains rate
20.00%
Primary advisor
Fidelity Management & Research Co. LLC
Distributor
Fidelity Distributors Corp.
FENY is part of a fund suite that marked Fidelity's official entry into the US sector ETF market. The fund offers a top-heavy portfolio in the US energy segment, with well over half of its portfolio weight in its top ten holdings, and a huge chunk of its allocation to the top few. Overall, its portfolio is broad, with allocations to every aspect of the oil and gas industries, and some allocations dedicated to coal and renewables. On December 1, 2020, FENY started tracking a capped version of its previous index, where the aggregate weight of issuers with over 5% weight in the index are now capped at 50% of the funds total asset. The fund uses a sampling strategy to track the index, which means the fund may not hold all the securities in the underlying index, but securities that provide a similar investment profile. The index is rebalanced quarterly
Related funds
Classification
What's in the fund
Exposure type
Energy Minerals
Industrial Services
Stock breakdown by region
Top 10 holdings

FENY - MSCI EnergyI am 80% bullish on the Energy ETF (FENY). I am planning to fill my position for August 2024 at $25.10.
I allocate a portion of my monthly salary to invest in ETFs. Currently, my position is with SPUS (S&P 500), but given the current bearish market for S&P's, FENY is my next best option for small c

SECTOR-ENERGYThis sector has been on a pretty good run and seems to be running out of steam and is trying to fall past the gray support line for the last run near a longer term resistance line. This leads me to believe that the sector is nearing the top for the time being. As so, I do not feel this is a good s

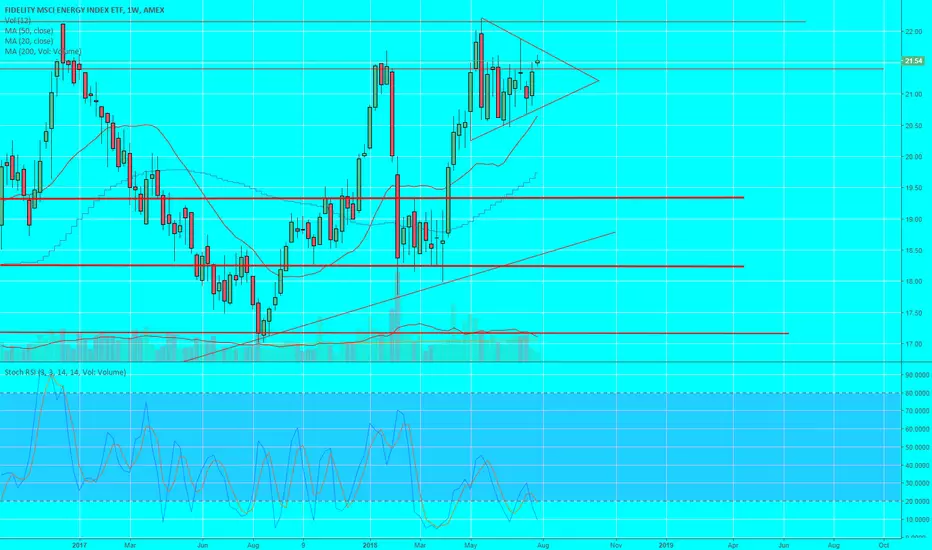
FENY, weekly bullish flag?Taking a look at this as it a commision free energy ETF on Fidelity, Looks like a textbook bullish flag is forming. I personally am hoping for a slight retrace to 21.00 before and explosion to 23 and beyong. Weekly chart so may take a month to play out but something to monitor alongside the price of
See all ideas
Summarizing what the indicators are suggesting.
Oscillators
Neutral
SellBuy
Strong sellStrong buy
Strong sellSellNeutralBuyStrong buy
Oscillators
Neutral
SellBuy
Strong sellStrong buy
Strong sellSellNeutralBuyStrong buy
Summary
Neutral
SellBuy
Strong sellStrong buy
Strong sellSellNeutralBuyStrong buy
Summary
Neutral
SellBuy
Strong sellStrong buy
Strong sellSellNeutralBuyStrong buy
Summary
Neutral
SellBuy
Strong sellStrong buy
Strong sellSellNeutralBuyStrong buy
Moving Averages
Neutral
SellBuy
Strong sellStrong buy
Strong sellSellNeutralBuyStrong buy
Moving Averages
Neutral
SellBuy
Strong sellStrong buy
Strong sellSellNeutralBuyStrong buy
Displays a symbol's price movements over previous years to identify recurring trends.
Frequently Asked Questions
An exchange-traded fund (ETF) is a collection of assets (stocks, bonds, commodities, etc.) that track an underlying index and can be bought on an exchange like individual stocks.
FENY trades at 24.04 USD today, its price has fallen −0.50% in the past 24 hours. Track more dynamics on FENY price chart.
FENY net asset value is 24.04 today — it's risen 1.46% over the past month. NAV represents the total value of the fund's assets less liabilities and serves as a gauge of the fund's performance.
FENY assets under management is 1.39 B USD. AUM is an important metric as it reflects the fund's size and can serve as a gauge of how successful the fund is in attracting investors, which, in its turn, can influence decision-making.
FENY price has risen by 2.34% over the last month, and its yearly performance shows a −3.57% decrease. See more dynamics on FENY price chart.
NAV returns, another gauge of an ETF dynamics, showed a 7.35% increase in three-month performance and has decreased by −0.40% in a year.
NAV returns, another gauge of an ETF dynamics, showed a 7.35% increase in three-month performance and has decreased by −0.40% in a year.
FENY fund flows account for −375.38 M USD (1 year). Many traders use this metric to get insight into investors' sentiment and evaluate whether it's time to buy or sell the fund.
Since ETFs work like an individual stock, they can be bought and sold on exchanges (e.g. NASDAQ, NYSE, EURONEXT). As it happens with stocks, you need to select a brokerage to access trading. Explore our list of available brokers to find the one to help execute your strategies. Don't forget to do your research before getting to trading. Explore ETFs metrics in our ETF screener to find a reliable opportunity.
FENY invests in stocks. See more details in our Analysis section.
FENY expense ratio is 0.08%. It's an important metric for helping traders understand the fund's operating costs relative to assets and how expensive it would be to hold the fund.
No, FENY isn't leveraged, meaning it doesn't use borrowings or financial derivatives to magnify the performance of the underlying assets or index it follows.
In some ways, ETFs are safe investments, but in a broader sense, they're not safer than any other asset, so it's crucial to analyze a fund before investing. But if your research gives a vague answer, you can always refer to technical analysis.
Today, FENY technical analysis shows the buy rating and its 1-week rating is buy. Since market conditions are prone to changes, it's worth looking a bit further into the future — according to the 1-month rating FENY shows the buy signal. See more of FENY technicals for a more comprehensive analysis.
Today, FENY technical analysis shows the buy rating and its 1-week rating is buy. Since market conditions are prone to changes, it's worth looking a bit further into the future — according to the 1-month rating FENY shows the buy signal. See more of FENY technicals for a more comprehensive analysis.
Yes, FENY pays dividends to its holders with the dividend yield of 3.24%.
FENY trades at a premium (0.00%).
Premium/discount to NAV expresses the difference between the ETF’s price and its NAV value. A positive percentage indicates a premium, meaning the ETF trades at a higher price than the calculated NAV. Conversely, a negative percentage indicates a discount, suggesting the ETF trades at a lower price than NAV.
Premium/discount to NAV expresses the difference between the ETF’s price and its NAV value. A positive percentage indicates a premium, meaning the ETF trades at a higher price than the calculated NAV. Conversely, a negative percentage indicates a discount, suggesting the ETF trades at a lower price than NAV.
FENY shares are issued by FMR LLC
FENY follows the MSCI USA IMI Energy 25/50 Index. ETFs usually track some benchmark seeking to replicate its performance and guide asset selection and objectives.
The fund started trading on Oct 21, 2013.
The fund's management style is passive, meaning it's aiming to replicate the performance of the underlying index by holding assets in the same proportions as the index. The goal is to match the index's returns.