US stocks are back leadingWorld markets bottomed on Spetember 2022 and during the recovery, European stocks AMEX:FEZ outperformed US stocks TVC:DJI for 9 months
Nos, for the last 3 months, US stocks are back in the leadership as the DJI/FEZ ratio broke its downtrend back in April; just weeks before the AMEX:FEZ broke its trendline
That is why relative strength is so important, sometimes gives leading signals
And for the last 3 months, energy AMEX:XLE has been the leading sector, with coal being the ledading industry, the thing is that stocks like NYSE:CEIX , NYSE:AMR and NYSE:NRP are already extended
Let's wait for a base formation in these leading stocks
FEZ trade ideas

play $FEZ for a bounceFEZ bounced right off the volume shelf where the POC is as well. It looks like it's going to have another V-shaped recovery after selling off heavily. Its RSI is oversold, and MACD looks like it could be beginning to turn around.
Overall the weekly chart looks good. It may be smart to wait for FEZ to crack $40.50 or $41 on high volume for extra confirmation.
One could argue that there was a morning star reversal pattern if you look at the candles of the most recent potential V-shaped bottom.


Above the big resistance dating back Dec 2007!I find AMEX:FEZ has been fairly accurate with the cycle analysis. You can see this tracing back on the chart over weeks and it sits almost perfectly with each dip (i've marked major ones in a yellow circle on the cycle).
Feeling very good about FEZ also because the ETF crossed a major resistance which was the Big Red Line.
Big Red line: Dec 07 all time high. Re-tested this move during Feb 18, Feb 2020 before the big Covid dip
Next resistance:
Green dotted line: This tests the highs set on Apr 19, Jun 19, and Jan 2020. I strongly believe FEZ will retest this line close to Feb-Apr 2021 based on cycle analysis. Price Target: $44.78
IF FEZ crosses the Green dotted line, the next resistance is:
Blue dotted line: Traces the Highs tested Dec 09, Apr 11, Jun 14.
Realistically I don't think we will see that price until 2021 second half. Price target: $47
Please share your thoughts and hit the like button for support.

EURO STOXX 50 next leg down?Unlike US indices, European stocks hit a perfect Fib level and will likely head lower in the next few weeks.

Foreign Stock ETFsOne of the most obvious - yet most overlooked relationships.
Foreign Stock ETFs priced in USD and their relationship to fluctuations in the currency market.
This chart depicts the Euro Stoxx 50 Index ETF (FEZ) which is priced in USD (blue line) and the level of out-performance during bear markets in the US Dollar.
A strong US Dollar will eat away at returns in these Country ETFs!

EURO STOXX Banks "oh shit hold on for your life"Welcome to the horror show. This is the weekly and could be the failure of the EU banking system playing out. :(

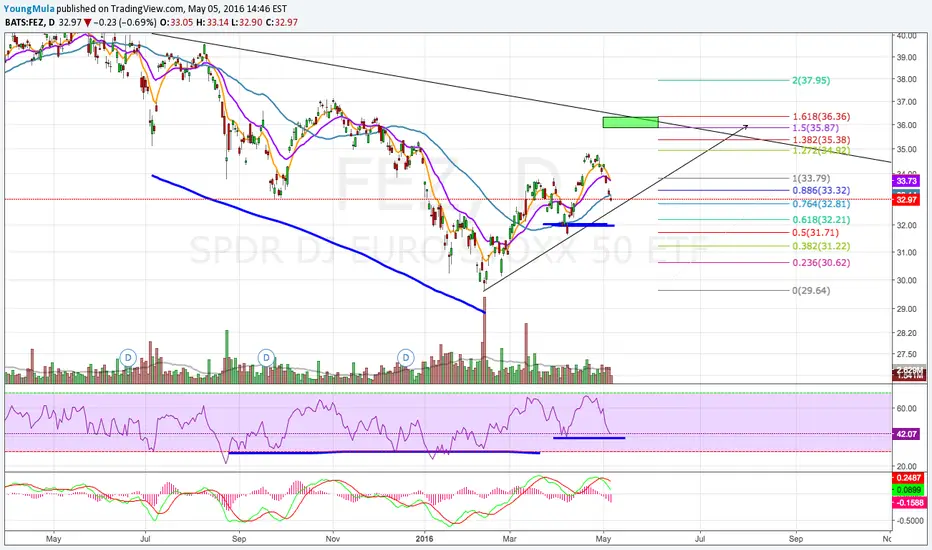
Bullish Eurostoxx 50 - breakout of long term resistanceLooking for a breakout around 43.70 which is long term resistance level and .50 retracement of 2007 highs.
Thereafter, profit target around 48.00 - the next resistance level.

FEZ Iron FlyWith the May 7 French election this Sunday the IV rank on FEZ today was decent at 46%. A 36/39/42 iron fly on June 16 expiry brought in $155 credit and $145 max loss. Breakevens at 37.45 and 40.55. By Monday morning I expect the IV to deflate quickly. After the first election round the IV in FEZ deflated 10 points when markets opened the next day. I'll aim close the whole trade early rather than hold to expiry.

Near the money Strangle on Euro Stocks (FEZ ETF)We have the French election coming up and other than my trades on FXE I didn't have much on play for that.
The IV Rank on FEZ is pretty high at 77 and I am selling the strangle with 30 days to go. After the first part of the election we might get a decent volatility. I am betting that Euro companies won't be impacted as much and I can get paid on the expensive premium.
Sold the 35/36 Strangle for $2.03 per contract.
55% probability of profit.

FEZ Breaking out!!!Here is my another pick for 2017. FEZ (EUROPEAN STOXX50) is breaking TL from 2014 on weekly chart. Daily is above cloud now. If we get one more dip lower and reverse, i will take a long here. Or another option to wait for break of 33,50. 34.72 is R1 and after that its clear. Can be a good trade with potential target of 45

Crash Warning For Euro STOXX 50 Equity IndexRunning Alpha Capital Markets Intelligence re-iterates its warning posted on Jan 11th, 2016 to Global Investors of an Imminent and Persistent Crash, specifically for Euro STOXX 50 Equity Index ( Symbol FEZ ) .
The benchmark European index, the Euro STOXX 50 should easily retest the crash lows of 2009; USA equity markets do not have a crash signal, but will experience heavy volatility in near term before turning euphoric with a powerful V-bottom recovery from 2016 into 2017. Euro STOXX 50 will see unprecedented volatility -- off the charts and likely accompanied by rapidly deteriorating fundamental and geo-political events.
In summary,
* Long USA Equity Leadership and Short Euro STOXX 50 Index is an opportunistic strategy for the environment upon us now through 2017.
* It is likely that no matter how significant short term volatility gets in USA over the very near term, the persistent panic selling to hit Euro STOXX 50 Index across all time horizons from the near term to the long term will be so extreme that money flows will likely create an episode of strong relative outperformance in USA markets all the way into 2017.

FEZ/SPY, is European stock market ready to sprint?QE has been announced in Europe.
Could it propel the european stock markets to All Time High like what Fed did to US stock market?
Indicator are lining up at the acceleration line.. lets get the stop clock ready..counting down :-)

Euro Stoxx 50 SPDR -FEZ - Top 50 European Stocks - Lagging Big Big enough decline to suggest some bottom fishing here. But why is it lagging the broad bounce in the US Market?
Stop listed. Upside potential. But only if you Sell Short SPY against a long in FEZ, Dollar for Dollar.
Tim
10/23/2014 37.75 +0.87 +2.36%

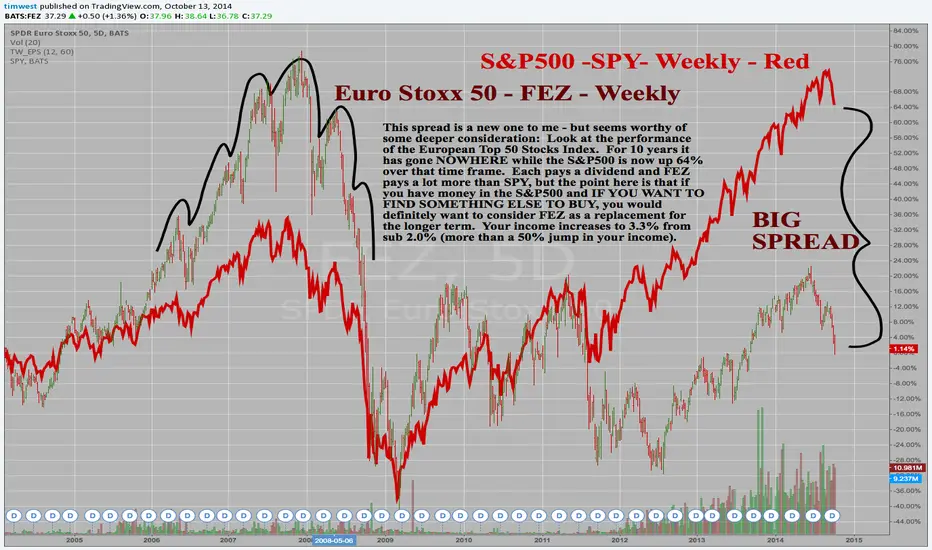
SPDR Euro Stoxx 50 - FEZ - Weekly - Long term underperformance S&P500 -SPY- Weekly - Red compares to the Euro Stoxx 50 - FEZ - Weekly:
This spread is a new one to me - but seems worthy of some deeper consideration: Look at the performance of the European Top 50 Stocks Index. For 10 years it has gone NOWHERE while the S&P500 is now up 64% over that time frame. Each pays a dividend and FEZ pays a lot more than SPY, but the point here is that if you have money in the S&P500 and IF YOU WANT TO FIND SOMETHING ELSE TO BUY, you would definitely want to consider FEZ as a replacement for the longer term. Your income increases to 3.3% from sub 2.0% (more than a 50% jump in your income).
From a market neutral perspective, it seems very easy to go long FEZ and sell short SPY, dollar for dollar, and hold this position for a year or two. The return would come from the relative return of these two instruments. A 60% return in a year or two seems very possible. Catalysts would be needed, of course, but I wonder if the recent S&P500 correction will lead investors to search far and wide for alternatives and then move their money slowly over time.
Tim 1:36PM EST October 13, 2014
SPY 190.82 +0.28 last (sell short)
FEZ 37.22 +0.43 last (go long, buy)
Extreme Selling Always Has Corrections -FEZI'm purely bored of Bitcoin at the moment and decided to go to TD to trade. So, today I decided to look at some ETFs.
What I have found is that currently $FEZ is being highly OVERSOLD for whatever reason. The bears may have taken over short term, but it looks like a correction is long overdue at this point. The current bear trend is not valid at this point.
Many indicators have been for month now stuck in OS mode.
PFE as been down below -100 for a long time, and I would guess that a correction is due soon.
PSAR is about to touch the price line which may in fact switch tomorrow to BUY. The rally may not last long, but even a few quick $ are nice to get.
StochRSI is reeving back up again and may start going above 50. I'd wait until then for it to confirm or you can take the risk now.
DC shows that price crossed over around the same time that the other indicators did. We'd need to get up to 42.75 for complete reversal, and anything before that is just a correction.
Aroon is still telling that the market is in downward period. Closer to zero would confirm some sort of trend up.
In conclusion, see what the this does in the next few days. Carefully watch the price along with the indicators. Once PFE gets going up there is no stopping it. Think of this as a mini bull/bear bubble market. Always a good time to buy when the market has completely overextended itself for a few weeks with not 1 correction.

Keep this negative divergence in the backburnerInitial divergence worked. But, divergence doesn't pay you, price does.


