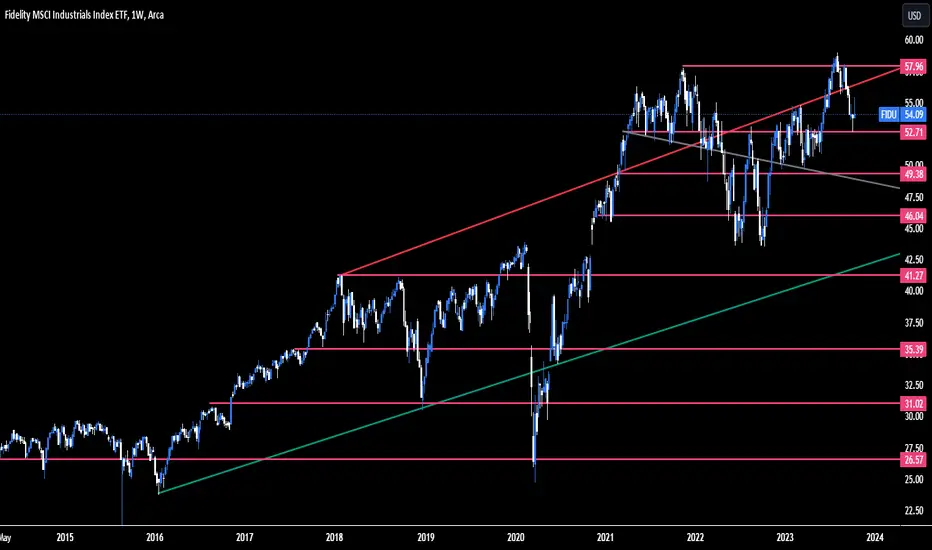
SECTOR-INDUSTRIALSThe industrial sector is another one that is riding near its long term resistance line, making it hard for me to want to add long positions from this point. I will be waiting for it to at least come down to the gray trend line before adding more. The dividend yield on this particular ETF is 1.46%
Key stats
About Fidelity MSCI Industrials Index ETF
Home page
Inception date
Oct 21, 2013
Structure
Open-Ended Fund
Replication method
Physical
Dividend treatment
Distributes
Distribution tax treatment
Qualified dividends
Income tax type
Capital Gains
Max ST capital gains rate
39.60%
Max LT capital gains rate
20.00%
Primary advisor
FMR Co., Inc.
Distributor
Fidelity Distributors Corp.
FIDU is one of the US sector funds, tracking MSCI indexes, launched by Fidelity in October 2013. It provides comprehensive plain-vanilla exposure to the broad industrials sector through a relatively liquid and efficient portfolio. Prior to December 1, 2020, the fund tracked the MSCI USA IMI Industrials Index, an uncapped version of the present index. To meet diversification requirements, FIDU now uses a 25/50 capping methodology. Notably, instead of replicating the underlying index, the fund uses a representative sampling strategy. The index is rebalanced quarterly.
Related funds
Classification
What's in the fund
Exposure type
Producer Manufacturing
Electronic Technology
Transportation
Stock breakdown by region
Top 10 holdings

Summarizing what the indicators are suggesting.
Oscillators
Neutral
SellBuy
Strong sellStrong buy
Strong sellSellNeutralBuyStrong buy
Oscillators
Neutral
SellBuy
Strong sellStrong buy
Strong sellSellNeutralBuyStrong buy
Summary
Neutral
SellBuy
Strong sellStrong buy
Strong sellSellNeutralBuyStrong buy
Summary
Neutral
SellBuy
Strong sellStrong buy
Strong sellSellNeutralBuyStrong buy
Summary
Neutral
SellBuy
Strong sellStrong buy
Strong sellSellNeutralBuyStrong buy
Moving Averages
Neutral
SellBuy
Strong sellStrong buy
Strong sellSellNeutralBuyStrong buy
Moving Averages
Neutral
SellBuy
Strong sellStrong buy
Strong sellSellNeutralBuyStrong buy
Displays a symbol's price movements over previous years to identify recurring trends.
Frequently Asked Questions
An exchange-traded fund (ETF) is a collection of assets (stocks, bonds, commodities, etc.) that track an underlying index and can be bought on an exchange like individual stocks.
FIDU trades at 81.86 USD today, its price has risen 1.19% in the past 24 hours. Track more dynamics on FIDU price chart.
FIDU net asset value is 81.76 today — it's risen 6.77% over the past month. NAV represents the total value of the fund's assets less liabilities and serves as a gauge of the fund's performance.
FIDU assets under management is 1.49 B USD. AUM is an important metric as it reflects the fund's size and can serve as a gauge of how successful the fund is in attracting investors, which, in its turn, can influence decision-making.
FIDU price has risen by 7.06% over the last month, and its yearly performance shows a 22.73% increase. See more dynamics on FIDU price chart.
NAV returns, another gauge of an ETF dynamics, have risen by 6.77% over the last month, showed a 21.04% increase in three-month performance and has increased by 24.73% in a year.
NAV returns, another gauge of an ETF dynamics, have risen by 6.77% over the last month, showed a 21.04% increase in three-month performance and has increased by 24.73% in a year.
FIDU fund flows account for 40.59 M USD (1 year). Many traders use this metric to get insight into investors' sentiment and evaluate whether it's time to buy or sell the fund.
Since ETFs work like an individual stock, they can be bought and sold on exchanges (e.g. NASDAQ, NYSE, EURONEXT). As it happens with stocks, you need to select a brokerage to access trading. Explore our list of available brokers to find the one to help execute your strategies. Don't forget to do your research before getting to trading. Explore ETFs metrics in our ETF screener to find a reliable opportunity.
FIDU invests in stocks. See more details in our Analysis section.
FIDU expense ratio is 0.08%. It's an important metric for helping traders understand the fund's operating costs relative to assets and how expensive it would be to hold the fund.
No, FIDU isn't leveraged, meaning it doesn't use borrowings or financial derivatives to magnify the performance of the underlying assets or index it follows.
In some ways, ETFs are safe investments, but in a broader sense, they're not safer than any other asset, so it's crucial to analyze a fund before investing. But if your research gives a vague answer, you can always refer to technical analysis.
Today, FIDU technical analysis shows the strong buy rating and its 1-week rating is buy. Since market conditions are prone to changes, it's worth looking a bit further into the future — according to the 1-month rating FIDU shows the strong buy signal. See more of FIDU technicals for a more comprehensive analysis.
Today, FIDU technical analysis shows the strong buy rating and its 1-week rating is buy. Since market conditions are prone to changes, it's worth looking a bit further into the future — according to the 1-month rating FIDU shows the strong buy signal. See more of FIDU technicals for a more comprehensive analysis.
Yes, FIDU pays dividends to its holders with the dividend yield of 1.27%.
FIDU trades at a premium (0.12%).
Premium/discount to NAV expresses the difference between the ETF’s price and its NAV value. A positive percentage indicates a premium, meaning the ETF trades at a higher price than the calculated NAV. Conversely, a negative percentage indicates a discount, suggesting the ETF trades at a lower price than NAV.
Premium/discount to NAV expresses the difference between the ETF’s price and its NAV value. A positive percentage indicates a premium, meaning the ETF trades at a higher price than the calculated NAV. Conversely, a negative percentage indicates a discount, suggesting the ETF trades at a lower price than NAV.
FIDU shares are issued by FMR LLC
FIDU follows the MSCI USA IMI Industrials 25/25 Index. ETFs usually track some benchmark seeking to replicate its performance and guide asset selection and objectives.
The fund started trading on Oct 21, 2013.
The fund's management style is passive, meaning it's aiming to replicate the performance of the underlying index by holding assets in the same proportions as the index. The goal is to match the index's returns.