FXCCAD is a winner in the upcoming roll-a-coaster. Let's go through the facts a strong economy and a "stable" geopolitical region should go well through all the threats ahead of us in 2022 and 2023.
Key stats
About Invesco CurrencyShares Canadian Dollar Trust
Home page
Inception date
Jun 21, 2006
Structure
Grantor Trust
Replication method
Physical
Dividend treatment
Distributes
Distribution tax treatment
Ordinary income
Income tax type
Ordinary Income
Max ST capital gains rate
39.60%
Max LT capital gains rate
39.60%
Distributor
Invesco Distributors, Inc.
FXC provides direct exposure to the Canadian currency by holding physical Canadian dollars in a JPMorgan deposit account. This simple structure allows the fund to closely track the CAD/USD spot exchange rate. FXC is fit for investors interested in accessing the Canadian dollar without the hassles of a separate foreign exchange account. Still, investors should note that: 1) there's no deposit insurance on its holdings, so it carries credit risk of its depository, JPMorgan, and 2) distributions and share sales are always taxed at ordinary-income rate, regardless of holding period.
Related funds
Classification
Geography
Canada
What's in the fund
Exposure type
Cash
Bonds, Cash & Other100.00%
Cash100.00%
Top 10 holdings

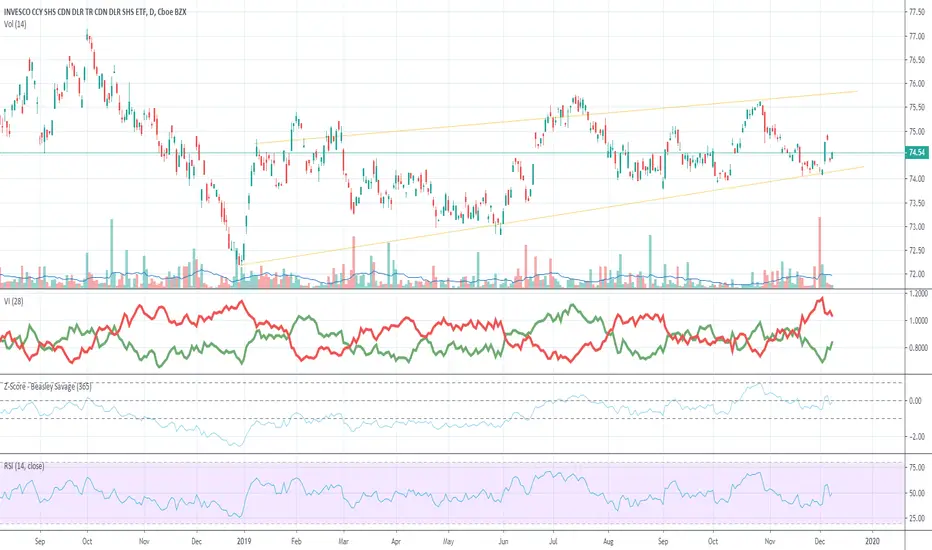
FXC - Bull Run - Higher LowsSo I bought some cheap 200-day call options already at the money just before the BoC announced they were holding the rates steady of 1.75%. This is against a US fed already doing QE and cutting rates will prove bullish for the CAD. We obviously will see with time, but this market looks good for comm


Rob Smith - smithintheblack - Quant Edge learning11/26/17 – Bias: Neutral. Conflicted with inside month
of November, inside month up, and outside up week.
4 inside weeks within the bearish month
of August. Week of 11/20, Outside week up. We will
must wait and see what actionable signals December
Brings. A move over 77.86, I would be bullish, and


PROJECT 1001 PIPS - MEDIAN LINE - DIVERGENCE GroupThis is the Group description for the Median Line/Divergence based set ups. Please refer to the notes and the comments.
To sign up for this group
Enter your detail here: goo.gl

Canadian Dollar temporary strength You can see the clear levels as prices dropped and are now rising towards the sell zone. I'm long at this bottom edge of consolidation and will exit at the red line, then reverse and short it.

See all ideas
Summarizing what the indicators are suggesting.
Oscillators
Neutral
SellBuy
Strong sellStrong buy
Strong sellSellNeutralBuyStrong buy
Oscillators
Neutral
SellBuy
Strong sellStrong buy
Strong sellSellNeutralBuyStrong buy
Summary
Neutral
SellBuy
Strong sellStrong buy
Strong sellSellNeutralBuyStrong buy
Summary
Neutral
SellBuy
Strong sellStrong buy
Strong sellSellNeutralBuyStrong buy
Summary
Neutral
SellBuy
Strong sellStrong buy
Strong sellSellNeutralBuyStrong buy
Moving Averages
Neutral
SellBuy
Strong sellStrong buy
Strong sellSellNeutralBuyStrong buy
Moving Averages
Neutral
SellBuy
Strong sellStrong buy
Strong sellSellNeutralBuyStrong buy
Displays a symbol's price movements over previous years to identify recurring trends.
Frequently Asked Questions
An exchange-traded fund (ETF) is a collection of assets (stocks, bonds, commodities, etc.) that track an underlying index and can be bought on an exchange like individual stocks.
FXC trades at 71.33 USD today, its price has fallen −0.43% in the past 24 hours. Track more dynamics on FXC price chart.
FXC net asset value is 71.35 today — it's fallen 0.43% over the past month. NAV represents the total value of the fund's assets less liabilities and serves as a gauge of the fund's performance.
FXC assets under management is 93.33 M USD. AUM is an important metric as it reflects the fund's size and can serve as a gauge of how successful the fund is in attracting investors, which, in its turn, can influence decision-making.
FXC price has risen by 0.24% over the last month, and its yearly performance shows a 0.69% increase. See more dynamics on FXC price chart.
NAV returns, another gauge of an ETF dynamics, have risen by −0.43% over the last month, have fallen by −0.43% over the last month, showed a 1.31% increase in three-month performance and has increased by 1.24% in a year.
NAV returns, another gauge of an ETF dynamics, have risen by −0.43% over the last month, have fallen by −0.43% over the last month, showed a 1.31% increase in three-month performance and has increased by 1.24% in a year.
FXC fund flows account for 31.46 M USD (1 year). Many traders use this metric to get insight into investors' sentiment and evaluate whether it's time to buy or sell the fund.
Since ETFs work like an individual stock, they can be bought and sold on exchanges (e.g. NASDAQ, NYSE, EURONEXT). As it happens with stocks, you need to select a brokerage to access trading. Explore our list of available brokers to find the one to help execute your strategies. Don't forget to do your research before getting to trading. Explore ETFs metrics in our ETF screener to find a reliable opportunity.
FXC invests in cash. See more details in our Analysis section.
FXC expense ratio is 0.40%. It's an important metric for helping traders understand the fund's operating costs relative to assets and how expensive it would be to hold the fund.
No, FXC isn't leveraged, meaning it doesn't use borrowings or financial derivatives to magnify the performance of the underlying assets or index it follows.
In some ways, ETFs are safe investments, but in a broader sense, they're not safer than any other asset, so it's crucial to analyze a fund before investing. But if your research gives a vague answer, you can always refer to technical analysis.
Today, FXC technical analysis shows the sell rating and its 1-week rating is buy. Since market conditions are prone to changes, it's worth looking a bit further into the future — according to the 1-month rating FXC shows the sell signal. See more of FXC technicals for a more comprehensive analysis.
Today, FXC technical analysis shows the sell rating and its 1-week rating is buy. Since market conditions are prone to changes, it's worth looking a bit further into the future — according to the 1-month rating FXC shows the sell signal. See more of FXC technicals for a more comprehensive analysis.
Yes, FXC pays dividends to its holders with the dividend yield of 1.13%.
FXC trades at a premium (0.03%).
Premium/discount to NAV expresses the difference between the ETF’s price and its NAV value. A positive percentage indicates a premium, meaning the ETF trades at a higher price than the calculated NAV. Conversely, a negative percentage indicates a discount, suggesting the ETF trades at a lower price than NAV.
Premium/discount to NAV expresses the difference between the ETF’s price and its NAV value. A positive percentage indicates a premium, meaning the ETF trades at a higher price than the calculated NAV. Conversely, a negative percentage indicates a discount, suggesting the ETF trades at a lower price than NAV.
FXC shares are issued by Invesco Ltd.
FXC follows the U.S. Dollar per Canadian Dollar. ETFs usually track some benchmark seeking to replicate its performance and guide asset selection and objectives.
The fund started trading on Jun 21, 2006.
The fund's management style is passive, meaning it's aiming to replicate the performance of the underlying index by holding assets in the same proportions as the index. The goal is to match the index's returns.