Key stats
About ProShares Ultrashort FTSE China 50
Home page
Inception date
Nov 6, 2007
Structure
Open-Ended Fund
Replication method
Synthetic
Dividend treatment
Distributes
Distribution tax treatment
Ordinary income
Income tax type
Capital Gains
Max ST capital gains rate
39.60%
Max LT capital gains rate
20.00%
Primary advisor
ProShare Advisors LLC
Distributor
SEI Investments Distribution Co.
FXP provides daily (-2x) inverse leveraged exposure to the popular FTSE China 50 Index the same index used by one of the most popular China ETFs, iShares' FXI. FXP's underlying index is heavily exposed to financials, energy and telecom companies, making the fund somewhat of a bet against these sectors that are dominated by state-owned enterprises, and somewhat less against a bet against the Chinese market overall. FXP rebalances its exposure on a daily basis, so the fund is meant for short-term trading over longer holding periods compounding effects could significantly impact the fund's targeted returns.
Related funds
Classification
What's in the fund
Exposure type
Cash
Bonds, Cash & Other100.00%
Cash100.00%
Top 10 holdings
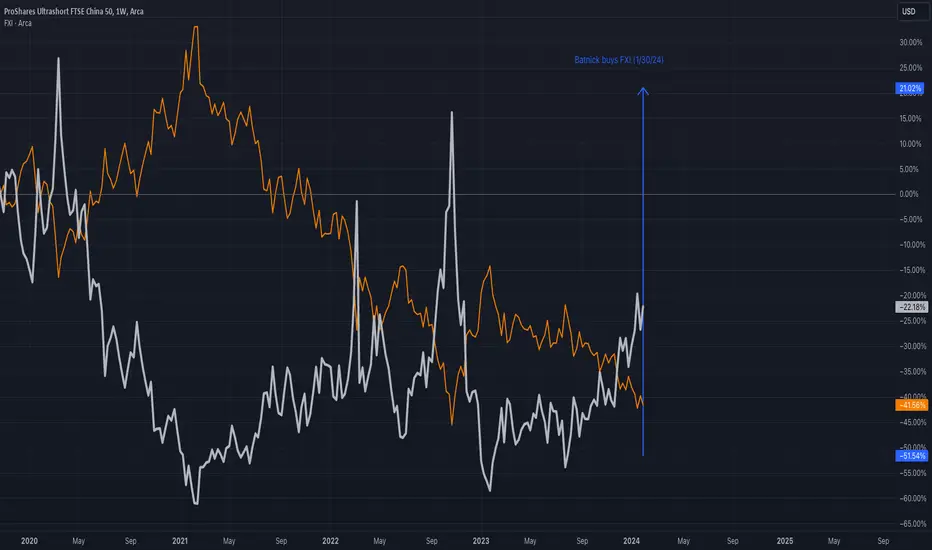
FXP | Chinese Stocks will Fall | LONGThe fund invests in financial instruments that ProShare Advisors believes, in combination, should produce daily returns consistent with the fund's investment objective. The index comprises 50 of the largest and most liquid Chinese stocks (H Shares, Red Chips and P Chips) listed and trading on the Ho

See all ideas
Summarizing what the indicators are suggesting.
Oscillators
Neutral
SellBuy
Strong sellStrong buy
Strong sellSellNeutralBuyStrong buy
Oscillators
Neutral
SellBuy
Strong sellStrong buy
Strong sellSellNeutralBuyStrong buy
Summary
Neutral
SellBuy
Strong sellStrong buy
Strong sellSellNeutralBuyStrong buy
Summary
Neutral
SellBuy
Strong sellStrong buy
Strong sellSellNeutralBuyStrong buy
Summary
Neutral
SellBuy
Strong sellStrong buy
Strong sellSellNeutralBuyStrong buy
Moving Averages
Neutral
SellBuy
Strong sellStrong buy
Strong sellSellNeutralBuyStrong buy
Moving Averages
Neutral
SellBuy
Strong sellStrong buy
Strong sellSellNeutralBuyStrong buy
Displays a symbol's price movements over previous years to identify recurring trends.
Frequently Asked Questions
An exchange-traded fund (ETF) is a collection of assets (stocks, bonds, commodities, etc.) that track an underlying index and can be bought on an exchange like individual stocks.
FXP trades at 9.91 USD today, its price has fallen −0.68% in the past 24 hours. Track more dynamics on FXP price chart.
FXP net asset value is 9.92 today — it's fallen 7.75% over the past month. NAV represents the total value of the fund's assets less liabilities and serves as a gauge of the fund's performance.
FXP assets under management is 6.37 M USD. AUM is an important metric as it reflects the fund's size and can serve as a gauge of how successful the fund is in attracting investors, which, in its turn, can influence decision-making.
FXP price has fallen by −7.85% over the last month, and its yearly performance shows a −69.80% decrease. See more dynamics on FXP price chart.
NAV returns, another gauge of an ETF dynamics, have fallen by −7.75% over the last month, showed a −19.07% decrease in three-month performance and has decreased by −67.99% in a year.
NAV returns, another gauge of an ETF dynamics, have fallen by −7.75% over the last month, showed a −19.07% decrease in three-month performance and has decreased by −67.99% in a year.
FXP fund flows account for 1.23 M USD (1 year). Many traders use this metric to get insight into investors' sentiment and evaluate whether it's time to buy or sell the fund.
Since ETFs work like an individual stock, they can be bought and sold on exchanges (e.g. NASDAQ, NYSE, EURONEXT). As it happens with stocks, you need to select a brokerage to access trading. Explore our list of available brokers to find the one to help execute your strategies. Don't forget to do your research before getting to trading. Explore ETFs metrics in our ETF screener to find a reliable opportunity.
FXP invests in cash. See more details in our Analysis section.
FXP expense ratio is 0.95%. It's an important metric for helping traders understand the fund's operating costs relative to assets and how expensive it would be to hold the fund.
FXP is an inverse fund, meaning it's structured to generate returns opposite to the trends of the underlying index or assets.
In some ways, ETFs are safe investments, but in a broader sense, they're not safer than any other asset, so it's crucial to analyze a fund before investing. But if your research gives a vague answer, you can always refer to technical analysis.
Today, FXP technical analysis shows the sell rating and its 1-week rating is sell. Since market conditions are prone to changes, it's worth looking a bit further into the future — according to the 1-month rating FXP shows the sell signal. See more of FXP technicals for a more comprehensive analysis.
Today, FXP technical analysis shows the sell rating and its 1-week rating is sell. Since market conditions are prone to changes, it's worth looking a bit further into the future — according to the 1-month rating FXP shows the sell signal. See more of FXP technicals for a more comprehensive analysis.
Yes, FXP pays dividends to its holders with the dividend yield of 10.42%.
FXP trades at a premium (0.01%).
Premium/discount to NAV expresses the difference between the ETF’s price and its NAV value. A positive percentage indicates a premium, meaning the ETF trades at a higher price than the calculated NAV. Conversely, a negative percentage indicates a discount, suggesting the ETF trades at a lower price than NAV.
Premium/discount to NAV expresses the difference between the ETF’s price and its NAV value. A positive percentage indicates a premium, meaning the ETF trades at a higher price than the calculated NAV. Conversely, a negative percentage indicates a discount, suggesting the ETF trades at a lower price than NAV.
FXP shares are issued by ProShare Advisors LLC
FXP follows the FTSE China 50 Net Tax USD Index. ETFs usually track some benchmark seeking to replicate its performance and guide asset selection and objectives.
The fund started trading on Nov 6, 2007.
The fund's management style is passive, meaning it's aiming to replicate the performance of the underlying index by holding assets in the same proportions as the index. The goal is to match the index's returns.