Elliott Wave Insight: GDX Climbs Higher After Three Wave DeclineThe rally in the Gold Miners Junior ETF (GDX) from its December 30, 2024 low remains intact. This rally is unfolding as a five-wave impulse pattern, as observed on the 1-hour chart below. Wave (4) of this impulse concluded at $44.75, setting the stage for wave (5) higher. Wave (5) is currently progressing with its own impulsive subdivision. From the wave (4) low, wave ((i)) peaked at $46.70, followed by a pullback in wave ((ii)) to $45.19. The ETF then surged in wave ((iii)) to $54.62. Subsequent correction in wave ((iv)) ended at $51.12. The final leg, wave ((v)), completed at $54.73, marking the end of wave 1 in the higher degree.
Following this, GDX entered a corrective wave 2, characterized by a clear seven-swing corrective structure. From the wave 1 peak, wave ((w)) declined to $52.19. It was then followed by a recovery in wave ((x)) to $53.74. The subsequent wave ((y)) bottomed at $50.70, completing wave 2. The ETF has since bounced from the 100%–161.8% Fibonacci extension zone of $49.61–$51.18. Currently, GDX could either resume its rally to new highs or stage a three-wave bounce before a potential larger double correction. However, even if a deeper pullback occurs, the corrective nature of the decline from the wave 1 peak supports a bullish outlook, suggesting that any downturn is likely a temporary pause within an ongoing uptrend.
GDX trade ideas

Gold Miners Break KEY multi-year resistanceIn the face of uncertainty, money flees to safe haven assets like Gold, Silver and the Dollar. When Gold moves up, gold miners do as well. As you can see from the weekly chart, the miners broke key resistance going all the way back to August 2020. These decade long highs at $46 were broken and there is a secondary trend line I have drawn that also intersects in the same area. The next probable move is for the miners to come down into the top of these trendlines and test the area as support before rocking to new all-time highs. Theres no guarantee that it will come down into this area, but if it does, you can bet your bottom dollar it'll be the buying opportunity of a lifetime.

Gold Miners Stocks Go 'The Rife Game' in Town. Here's WhyGold mining stocks have emerged as one of the top-performing asset classes in 2025, driven by a combination of surging gold prices, improved profitability, and shifting investor sentiment.
Here’s fundamental and technical analysis of the key factors behind this outperformance, by our @PandorraResearch Super-Duper Beloved Team :
Record-High Gold Prices Fuel Margins
Gold prices surpassed $3,000 per ounce in March 2025 for the first time in history, marking a 14% year-to-date increase. This rally stems from:
Safe-haven demand amid geopolitical tensions, economic and political uncertainty including U.S. trade policy volatility.
Central bank buying , particularly by China, India, Turkey, and Poland, to diversify away from the U.S. dollar.
Anticipated interest rate cuts , which reduce the opportunity cost of holding non-yielding assets like gold.
Higher gold prices directly boost miners’ revenues.
For example, the NYSE Arca Gold Miners Index NYSE:GDM returned nearly 30% YTD by early March, outpacing both physical gold OANDA:XAUUSD (+14.5%) and the S&P 500 SP:SPX (-3.8%). Companies like Agnico Eagle Mines NYSE:AEM and Wheaton Precious Metals NYSE:WPM reached all-time highs, while ASX-listed miners such as Evolution Mining ASX:EVN (+39.5% YTD) and West African Resources ASX:WAF (+56.6% YTD) outperformed Australia’s broader market.
Margin Expansion and Shareholder Returns
Gold miners are leveraging rising prices to improve profitability:
Stabilized costs for labor, energy, and equipment have widened profit margins.
Free cash flow growth enabled dividend hikes and share buybacks. U.S. Global Investors, for instance, offers a 3.91% annualized dividend yield.
Undervalued stocks: Many miners traded at historically low valuations relative to gold prices, creating buying opportunities. Barrick Gold NYSE:GOLD (P/E 15.6) and Newmont Corp NYSE:NEM (P/E 15.5) remained attractively priced despite gains.
Royal Gold NASDAQ:RGLD , a streaming company with a 60.3% operating margin, exemplifies how non-traditional miners capitalize on gold’s rally without direct operational risks.
Sector-Specific Catalysts
Mergers and acquisitions. Consolidation activity has increased, with larger firms acquiring high-potential projects.
Copper exposure. Miners like Evolution Mining benefit from rising copper demand, diversifying revenue streams.
Institutional upgrades. Analysts at Macquarie and Morgan Stanley endorsed Newmont and Evolution Mining, citing currency tailwinds and free cash flow potential.
Macroeconomic and Market Dynamics
Dollar weakness. A declining U.S. dollar enhances gold’s appeal as a hedge.
Equity market volatility. With the S&P 500 struggling, investors rotated into gold equities for diversification (0.3 correlation to broader markets).
Fiscal deficits. U.S. budget imbalances and inflationary pressures reinforced gold’s role as a store of value.
Outlook for 2025
Analysts project further gains, with gold potentially reaching $3,300 per ounce. Miners are expected to sustain momentum through:
Operational efficiency improvements to align with higher gold prices.
Continued capital discipline , avoiding overinvestment in new projects.
Dividend growth , as seen with U.S. Global Investors’ monthly payouts.
Technical Outlook
The main technical graph for Gold Miners ETF AMEX:GDX indicates on further Long-Term Bullish opportunity, to double the price over next several years, in a case of the epic $45 mark breakthrough.
Conclusion
In summary, gold miners’ 2025 rally reflects a confluence of macroeconomic uncertainty, disciplined capital management, and gold’s structural demand drivers. While risks like cost inflation persist, the sector’s fundamentals and valuation upside position it as a compelling component of diversified portfolios.
--
Best 'Golden Rife' wishes,
@PandorraResearch Team 😎

Gold Miners (GDX) at Key Support, Set for Potential Upside MoveThe Gold Miners ETF (GDX) is showing promising signs for investors as it approaches a critical support zone. Since the low on December 30, 2024, GDX has been tracing a five-wave impulse pattern. This is a hallmark of bullish momentum in Elliott Wave analysis. The first wave (wave (1)) peaked at $42.66, followed by a pullback to $38.58 in wave (2). From there, GDX surged in wave (3) to $53.25, as seen on the one-hour chart below. Currently, the ETF is in a corrective wave (4), unfolding as a zigzag pattern, which is nearing completion.
The zigzag’s wave A dropped to $46.73, with its internal structure showing five sub-waves. Wave ((i)) at $50.95, a rally to $52.99 in wave ((ii)), a decline to $47.77 in wave ((iii)), a bounce to $50.09 in wave ((iv)), and a final dip to $46.73 in wave ((v)). Wave B then rallied to $51.39, also as a zigzag, with sub-waves ((a)) at $49.1, ((b)) at $48.05, and ((c)) at $51.39. Now, wave C is underway, with wave ((i)) at $48.72, wave ((ii)) at $50.48, and wave ((iii)) at $44.45. Wave ((iv)) is expected to conclude soon, leading to a final drop in wave ((v)) to the $40.81–$44.86 blue box range.
This blue box area represents a key support zone where buying interest is likely to emerge. Investors should watch this range closely, as it could mark the end of the correction and the start of the next leg higher in wave (5). With GDX poised at this critical juncture, the setup favors taking long positions in anticipation of a bullish reversal.

Trading Journal $GDX Bought as it tried breaking out...
Sold due to news event with US and China agreeing on 90 day pause trade deal. GLD reversed, markets went up..
Instituiton likely to sell their position and move into the companies now

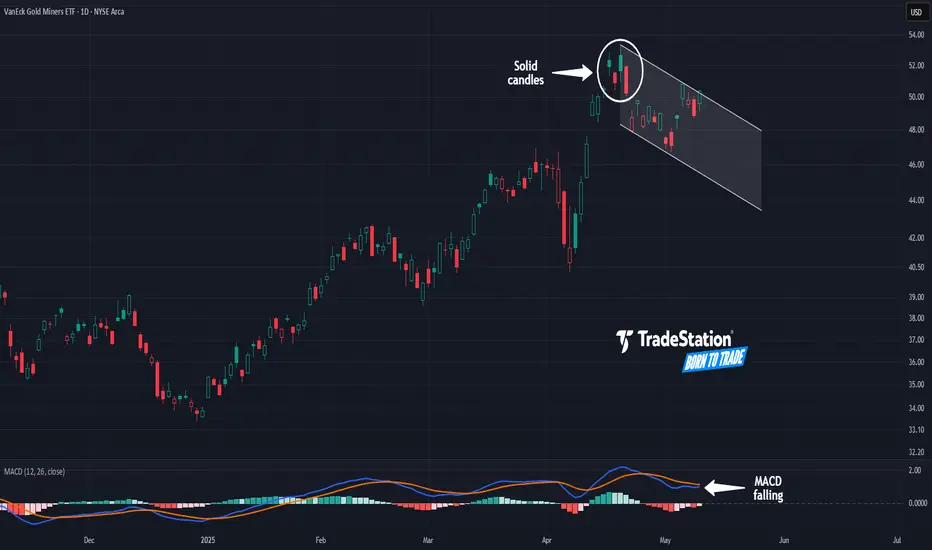
Gold Miners May Be FatiguedThe VanEck Gold Miners ETF had a major breakout in March, but some traders may think it’s getting fatigued.
The first pattern on today’s chart is the series of candles on April 16-22. Those bars occurred at the highest levels in almost four years. They’re also solid, illustrating that price wasn't able to hold the peaks.
Second, GDX fell sharply afterwards and made a lower high last week. That could mean April represented a peak. It could additionally suggest a new downward channel is taking shape.
Third, MACD is falling.
Next, gold and gold miners have benefited from the uncertainty caused by tariffs. Now, with signs of the trade war easing, some traders may find less appeal in the yellow metal.
Finally, GDX is an active underlier in the options market. (It averages more than 140,000 contracts per session, according to TradeStation Data.) That could help traders take positions with calls and puts.
Standardized Performances for the ETF mentioned above:
VanEck Gold Miners ETF (GDX)
1-year: +47.93%
5-years: +51.92%
10-year: +143.71%
(As of April 30, 2025)
Exchange Traded Funds ("ETFs") are subject to management fees and other expenses. Before making investment decisions, investors should carefully read information found in the prospectus or summary prospectus, if available, including investment objectives, risks, charges, and expenses. Click here to find the prospectus.
TradeStation has, for decades, advanced the trading industry, providing access to stocks, options and futures. If you're born to trade, we could be for you. See our Overview for more.
Past performance, whether actual or indicated by historical tests of strategies, is no guarantee of future performance or success. There is a possibility that you may sustain a loss equal to or greater than your entire investment regardless of which asset class you trade (equities, options or futures); therefore, you should not invest or risk money that you cannot afford to lose. Online trading is not suitable for all investors. View the document titled Characteristics and Risks of Standardized Options at www.TradeStation.com . Before trading any asset class, customers must read the relevant risk disclosure statements on www.TradeStation.com . System access and trade placement and execution may be delayed or fail due to market volatility and volume, quote delays, system and software errors, Internet traffic, outages and other factors.
Securities and futures trading is offered to self-directed customers by TradeStation Securities, Inc., a broker-dealer registered with the Securities and Exchange Commission and a futures commission merchant licensed with the Commodity Futures Trading Commission). TradeStation Securities is a member of the Financial Industry Regulatory Authority, the National Futures Association, and a number of exchanges.
Options trading is not suitable for all investors. Your TradeStation Securities’ account application to trade options will be considered and approved or disapproved based on all relevant factors, including your trading experience. See www.TradeStation.com . Visit www.TradeStation.com for full details on the costs and fees associated with options.
Margin trading involves risks, and it is important that you fully understand those risks before trading on margin. The Margin Disclosure Statement outlines many of those risks, including that you can lose more funds than you deposit in your margin account; your brokerage firm can force the sale of securities in your account; your brokerage firm can sell your securities without contacting you; and you are not entitled to an extension of time on a margin call. Review the Margin Disclosure Statement at www.TradeStation.com .
TradeStation Securities, Inc. and TradeStation Technologies, Inc. are each wholly owned subsidiaries of TradeStation Group, Inc., both operating, and providing products and services, under the TradeStation brand and trademark. When applying for, or purchasing, accounts, subscriptions, products and services, it is important that you know which company you will be dealing with. Visit www.TradeStation.com for further important information explaining what this means.
Sol GDX Review Studying the weekly and daily structure of GDX using ICT concepts: breaker blocks, order blocks, and liquidity. Looking for price reaction around the weekly order block and possible short-term displacement. Feedback and insights welcome!

SHORT GDX or LONG DUST // Swing TradingAfter correction of Gold (GLD) day before yesterday.
A equity market open for a risk-on scenario, maybe cooldown the gold rally for a while.
Today GDX filled the gap of the yesterday decline stopin at $50 (yellow mark).
Target $44-$45. First level of Fibonacci.

Gold Miners ETF (GDX) Surges in Strong Nested ImpulseThe Elliott Wave analysis for the VanEck Gold Miners ETF (GDX) shows a strong bullish trend since December 30, 2024. This rally forms a “nesting impulse” pattern with smaller waves building into an extended third wave. From the December low, wave (1) peaked at $42.66, followed by a wave (2) pullback to $38.58. GDX then entered a powerful wave (3) with nested sub-waves driving prices higher.
In wave (3), wave 1 rallied to $46.94, with wave 2 correcting to $39.95. Wave 3 extended upward, with sub-wave ((i)) ending at $43.70. Sub-wave ((ii)) corrected to $40.91, then sub-wave ((iii)) surged to $52.91. Strong bullish momentum continues to dominate the gold mining sector. A pullback in sub-wave ((iv)) is now expected, attracting buyers for sub-wave ((v)). This should complete wave 3 before a larger wave 4 correction.
As long as the $39.95 pivot holds, dips should find support. Support may form in a 3, 7, or 11-swing pattern. This signals more upside potential for GDX in the near term. Investors should watch these levels for strategic buying opportunities. The pattern suggests sustained interest in gold mining equities. Favorable commodity cycles likely contribute to this bullish sentiment.

GDX Gold miner ETF looking promising right now GDX Gold miner ETF looking promising right now
Similar to other precious metal price action right now

Elliott Wave View: Gold Miners ETF (GDX) Impulse Rally Should ExGold Miners ETF (GDX) shows incomplete bullish sequence from 30 December 2024 low favoring more upside. Up from 30 December, wave (1) ended at 43 and pullback in wave (2) ended at 38.58. Wave (3) higher is in progress with internal subdivision as a 5 waves impulse Elliott Wave structure. Up from wave (2), wave 1 ended at 42.31 and pullback in wave 2 ended at 40.2 as the 30 minutes chart below shows.
Wave 3 higher is in progress as another impulse in lesser degree. Up from wave 2, wave ((i)) ended at 41.22 and pullback in wave ((ii)) ended at 40.71. The ETF then nested higher in wave ((iii)). Up from wave ((ii)), wave (i) ended at 42.04 and pullback in wave (ii) ended at 41.22. Wave (iii) higher ended at 43.87 and pullback in wave (iv) ended at 43.21. Final leg wave (v) ended at 45.65 which completed wave ((iii)) in higher degree. Pullback in wave ((iv)) is in progress with a target towards 43.6 – 44.2 where buyers can appear for further upside. Near term, as far as pivot at 40.2 low stays intact, expect dips to find support in 3, 7, 11 swing for further upside.

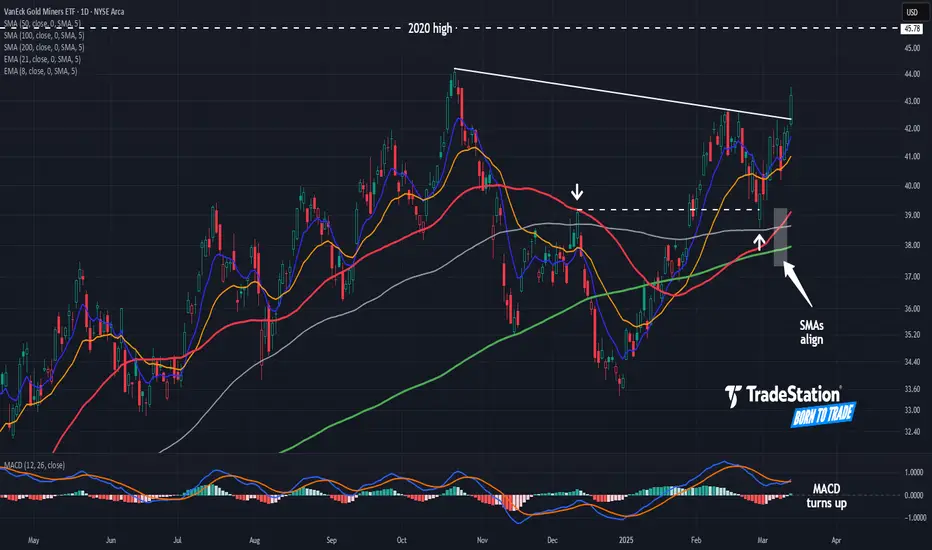
Are Gold Miners Going Higher?Gold miners are one of the top-performing industries this year, and some traders may see further upside in a key ETF tracking the group.
The first pattern on today’s chart of the VanEck Gold Miners ETF is the falling trendline along the highs of October and February. GDX cleared that resistance on Thursday, which may suggest a breakout is underway.
Second, the 50-day simple moving average (SMA) rose above the 200-day SMA in February and above the 100-day SMA in March. That alignment, with faster SMAs above slower SMAs, may be consistent with a longer-term uptrend.
Third, the ETF peaked around $39 in December and bounced at the same level on February 28. Did old resistance become new support?
Next, MACD just turned positive. The 8-day exponential moving average (EMA) is also above the 21-day EMA. Those are potentially bullish short-term signals.
Fifth, GDX remains below its 2020 high of $45.78 –- despite physical gold setting new records. The ETF is also still under peaks from early last decade. Investors may wonder whether the producing companies are undervalued on a relative basis.
Finally, TradeStation data shows GDX averaging roughly 128,000 options per day in the last month. That may help traders position for moves with calls and puts.
Standardized Performances for the ETF mentioned above:
VanEck Gold Miners ETF (GDX)
1-year: +52.63%
5-years: +34.98%
10-year: +83.14%
(As of February 28, 2025)
Exchange Traded Funds ("ETFs") are subject to management fees and other expenses. Before making investment decisions, investors should carefully read information found in the prospectus or summary prospectus, if available, including investment objectives, risks, charges, and expenses. Click here to find the prospectus.
TradeStation has, for decades, advanced the trading industry, providing access to stocks, options and futures. If you're born to trade, we could be for you. See our Overview for more.
Past performance, whether actual or indicated by historical tests of strategies, is no guarantee of future performance or success. There is a possibility that you may sustain a loss equal to or greater than your entire investment regardless of which asset class you trade (equities, options or futures); therefore, you should not invest or risk money that you cannot afford to lose. Online trading is not suitable for all investors. View the document titled Characteristics and Risks of Standardized Options at www.TradeStation.com . Before trading any asset class, customers must read the relevant risk disclosure statements on www.TradeStation.com . System access and trade placement and execution may be delayed or fail due to market volatility and volume, quote delays, system and software errors, Internet traffic, outages and other factors.
Securities and futures trading is offered to self-directed customers by TradeStation Securities, Inc., a broker-dealer registered with the Securities and Exchange Commission and a futures commission merchant licensed with the Commodity Futures Trading Commission). TradeStation Securities is a member of the Financial Industry Regulatory Authority, the National Futures Association, and a number of exchanges.
Options trading is not suitable for all investors. Your TradeStation Securities’ account application to trade options will be considered and approved or disapproved based on all relevant factors, including your trading experience. See www.TradeStation.com . Visit www.TradeStation.com for full details on the costs and fees associated with options.
Margin trading involves risks, and it is important that you fully understand those risks before trading on margin. The Margin Disclosure Statement outlines many of those risks, including that you can lose more funds than you deposit in your margin account; your brokerage firm can force the sale of securities in your account; your brokerage firm can sell your securities without contacting you; and you are not entitled to an extension of time on a margin call. Review the Margin Disclosure Statement at www.TradeStation.com .
TradeStation Securities, Inc. and TradeStation Technologies, Inc. are each wholly owned subsidiaries of TradeStation Group, Inc., both operating, and providing products and services, under the TradeStation brand and trademark. When applying for, or purchasing, accounts, subscriptions, products and services, it is important that you know which company you will be dealing with. Visit www.TradeStation.com for further important information explaining what this means.

Short GDX!
Hit resistance trying to re enter strong price channel. 40$ Either the chart speaks for itself or it don’t

GDX - Gold Miners ETF: Inverse Head & shouldersGold prices have surged to unprecedented levels in light of recent trade policy changes. The announcement by US President Donald Trump regarding a new 25% tariff on essential imports such as cars, semiconductors, and pharmaceuticals has created a wave of uncertainty among investors. This risk-off sentiment has driven many to seek refuge in safe-haven assets like gold.
Nevertheless, this upward momentum may encounter challenges if a trade agreement with China comes to fruition. A successful deal could alleviate global trade tensions, leading to a decrease in gold demand and possibly resulting in selling pressure.
However sustained high bullion prices could prove to be a significant advantage for gold miners. The GDX ETF is showing a persistent inverse head and shoulders pattern, indicating potential for further gains.

Elliott Wave View: Gold Miners ETF (GDX) Impulse Rally ProgressShort Term Elliott Wave View in Gold Miners ETF (GDX) suggests rally from 12.30.2024 low is in progress as an impulse. Up from 12.30.2024 low, wave 1 ended at 38.2 and dips in wave 2 ended at 36.84. Internal subdivision of wave 2 unfolded as a zigzag Elliott Wave structure. Down from wave 1, wave ((a)) ended at 37.31 and wave ((b)) ended at 37.95. Wave ((c)) lower ended at 36.83 which completed wave 2 in higher degree.
The ETF has extended higher in wave 3 with subdivision as a 5 waves with extension (a nesting impulse). Up from wave 2, wave ((i)) ended at 38.16 and pullback in wave ((ii)) ended at 36.84. The ETF extended higher in wave (i) towards 39.73 and pullback in wave (ii) ended at 38.14. Up from there, wave i ended at 39.92 and wave ii ended at 39.24. Wave iii higher ended at 41.53 and pullback in wave iv ended at 40.80. Expect the ETF to end wave v of (iii), then it should pullback in wave (iv) before higher again. Near term, pullback should find support in 3, 7, or 11 swing against 36.83 low for further upside.

Opening (IRA): GDX Dec 20th 36 Covered Call... for a 35.29 debit.
Comments: Selling the -75 delta call against stock to emulate the delta metrics of a 25 delta short put, but with the built-in defense of the short call.
Metrics:
Buying Power Effect/Break Even: 35.29/share
Max Profit: .71
ROC at Max: 2.01%
50% Max: .36
ROC at 50% Max: 1.00%
That 1.00% ROC at 50% max is kind of "marginal," but just trying to keep theta on and burning with little stuff that I can add to should I have the opportunity to get in in higher IV/weakness.

Opening (IRA): GDX January 17th 34 Covered Call... for a 33.28 debit.
Comments: Selling the -75 delta call against stock to emulate the delta metrics of a 25 delta short put, but with the built-in defense of the short call. Adding at strikes/break evens better than what I currently have on. This puppy also happens to have a dividend on offer in December, but is quite variant: www.nasdaq.com
Metrics:
Buying Power Effect/Break Even: 33.28
Max Profit: .72
ROC at Max: 2.16%
50% Max: .36
ROC at 50% Max: 1.08%

Adding GDX for a swing position GDX has been trading in this channel been slowly entering swing position

Are Retail all aboard the gold train?When social media is buzzing with Gold fever now that Gold broke through 2700, is a major shakeout needed for the bull to keep running

My Watchlist: GDXGDX, I have a green setup signal(dot Indictor). It has an excellent risk-to-reward ratio(RR:). I'm looking to enter long near the close of the day if the stock can manage to TRADE above the last candle highs(white line). If triggered, I will then place a stop-loss below(red line) and a price target above it(green line).
********
Note: The above setups will remain valid until the stock CLOSES BELOW my set stop-loss level.

Elliott Wave View on GDX Favors Pullback Before RallShort Term Elliott Wave View in GDX suggests the zigzag correction should find support towards extreme areas before resume higher to finish the impulse sequence from 5-August, 2024 low. It is showing higher high sequence in daily from September-2022 low and expect short term rally to continue against August-2024 low. Since 5-August, 2024 low, it placed 1 at 39.97 high and 2 correction at 36.22 low as 0.618 Fibonacci retracement. Above 36.22 low, it placed ((i)) of 3 at 36.89 high, ((ii)) at 36.44 low, ((iii)) as extended wave at 40.98 high, ((iv)) at 39.02 low and finally ((v)) as 3 at 42.12 high.
Below 3 high, it favors zigzag correction in 4 against 6-September, 2024 low before resume higher. Below 42.12 high, it favors pullback in ((c)) of 4 started from 40.79 high. It placed ((a)) of 4 at 39.35 low as 5 swing sequence, while placed ((b)) at 40.79 high. Within ((a)), it placed (i) at 41.22 low, (ii) at 41.95 high, (iii) at 39.96 low, (iv) at 40.75 high and (v) as ((a)) at 39.35 high. Below ((b)) high, it placed (i) at 39.12 low and (ii) at 40.19 high. Currently, it favors lower in (iii) and expect short term weakness towards 38.03 or lower levels to finish zigzag before resume higher in 5 as possible diagonal from August-2024 low.

Opening (IRA): GDX Oct 18th 32/37/37/42 Iron Fly... for a 2.66 credit.
Comments: High IVR/High IV (59.8/35.2). Some more "little stuff" in that 45 DTE wheelhouse while I wait for other things to come in or require management.
Metrics:
Max Profit: 2.66
Buying Power Effect: 2.34
ROC at Max: 113.68%
25% Max: .67
ROC at 25% Max: 25.19%
