GDX last coil ?GDX yet again pushing lower. Obvious reasons in Daily chart (right)
Inthe next two weeks, it is likely to be looking near the last low, for a higher low... the third time it is doing this. Possible the last coiling before a bull run develops.
Wait for it...
GDX trade ideas

GDX/GLD is not supporting last spikeGDX/GLD work well when it comes to divergence. We are already in a good resistance.

GDX An Incomplete sequence Favors More DownsideThe Elliott wave view in GDX suggests that the main cycle from the August 20, 2020 peak is showing an incomplete sequence. Favoring more downside to happen based on sequence towards $24.80- $21.36 area lower before a turn back higher happens. While the short-term cycle suggests that the decline to $30.05 low ended wave 1 of (C) in 5 waves lower. Up from there, GDX did an expanded flat correction in wave 2 bounce.
While an initial 3 swing bounce ended wave ((a)) at a $31.59 high. Down from there, wave ((b)) also ended in 3 swings at $28.90 low. Then the bounce in ((c)) leg unfolded in 5 wave impulse sequence. In which, wave (i) ended at $30.16 high, wave (ii) ended at $29.95 low, wave (iii) ended at $31.54, wave (iv) ended at $31.19 low, and wave (v) ended at $31.77 high. Thus ended wave 2 as an expanded flat correction.
Below from there, GDX declined in 5 waves lower & ended small wave ((i)) of 3 at $30.15 low. And now doing a 3 swing bounce in wave ((ii)), which can see $31.29- $31.51 area before turning lower again. Near-term, as far as bounces fail below $31.77 high then ETF is expected to fail lower looking for more downside. Alternatively, if it breaks above $31.77 high then it can even see $33.01- $34.77 area higher before seeing sellers again.

GDX consolidating to downside biasQuick update that previous attempt for GDX to rally up was pre-mature. Still not yet in a bull trend.
Weekly chart had a break out above 55EMA fail in the last couple of weeks, only to bounce off a support. Technicals not totally aligned so may consolidate for a couple more weeks before some clarity forms.
Daily chart (right panel) shows the failed attempt, which now has a clear resistance line (lime green). Last week ended with a failure type downward candlestick, suggesting weakness in a rally. Technicals appear somewhat bullish, in contrast to weekly chart.
Expecting some consolidation, with a little downside bias within range.

Miners Rise and FallHello everyone, I am predicting a rise and very likely big fall of the gold miners. Seasonally the last 3 years the precious metals space has risen into the end of the year and peaking in early January. I do not expect any different this year with Powell recently coming out at the last FOMC meeting and saying 3 rate hikes in 2022.
But what about all the money printing and historically low real yields you say? Well that just doesn't matter to the market right now with the broader market moving higher and dancing until the music stops. Precious metals won't be making fresh 5 year highs until a substantial market selloff, and even then miners will most likely fall with the market however brief it may be. Or on the first rate hike next year if miners and metals are shorted heavily because of the Fed narrative there could be a massive short covering rally similar to what we saw in January to August of 2016. This is just my opinion not trading advice do your own DD. Good luck traders and happy holidays!

GDX: Pushing for dem Lows! 🥸🥸🥸The GDX ist moving downwards again, which is the primary direction we are expecting this market to develop. With this turnaround, an alternative surge is now neutralized and we now need to wait for the course to reach the area around $22.51, where we expect the next turnarund - but this time to aim for rising prices. It remains important here that the course does not drop below $16.18.
Have a great start to the week!

GDX Weekly Inverse Trampoline with lower time frame "timing"Did you see the inverse trampoline on the weekly GDX?
Here's one way to help "time" entry into the larger timeframe utilizing
lower timeframe like setup.
Hope you find this to be of help.


long and short GDXFinding divergence on the 1HR chart and the 1Day chart, I like these settings for GDX setups.

$GDX PT 39Wave 3 PT 39 - Calls here super cheap even for time. Should be hitting 39 on this impulse up. About to pullback for a minute 2. All dips are a buy here


Elliott Wave View: GDX Starts New Bullish CycleShort Term Elliott Wave view on GDX suggests cycle from October 4, 2021 low is in progress as a 5 waves impulse Elliott Wave structure. Up from October 4 low, wave (1) ended at 33.95 and pullback in wave (2) ended at 30.96. The ETF then extended higher and broke above wave (1), suggesting wave (3) has started. Up from wave (2) low, wave ((i)) ended at 32.69 and pullback in wave ((ii)) ended at 31.65. The ETF then extends higher in wave ((iii)) with internal subdivision as another impulse in lesser degree. Up from wave ((ii)) low, wave (i) ended at 33.15 and wave (ii) ended at 32.57. Wave (iii) ended at 34.83, wave (iv) ended at 34.21, and wave (v) of ((iii)) ended at 35.01. Pullback in wave ((iv)) ended at 34.47.
Near term, while dips stay above 30.96, expect the ETF to extend higher in wave ((v)). This move should also end wave 1 in higher degree and complete cycle from November 3 low. Afterwards, GDX should pullback in wave 2 to correct cycle from November 3 low in 3, 7, or 11 swing before the rally resumes. Potential target higher is 100% – 161.8% fibonacci extension from October 4 low towards 36.17 – 39.37. Near term, as far as pivot at 30.96 low stays intact, expect dips to find support in 3, 7, or 11 swing for further upside.

GDX- Reverse head and Shoulder patternGDX - Broke the Lower lows and lower high pattern a month back - Completed corrective wave pattern.
Formed the R H S .
Broke out the RHS
Above VWAP.
Directionally very bullish till resistance zone marked in yellow .

GDX beautiful setupGDX has a lot going for it.
Nice H&S headed to a breakout
Channel breakout
Falling Wedge breakout
Above 33.50 it should trigger the H&S break, and above 34 it will probably get this moving towards 36

GDX Trampoline (within possible inverted H&S)A look at the GDX on the daily, in conjunction with the 15min.
Several things going on here, more detail on chart.
Hopefully this provides some insight(s).

GDX Wedge - SHS - BACA
GDX ETF , Wedge break out, potential SHS Neckline, BACA.
Above 2016 Support Level.

$GDX Beautiful .618 bounce First PT 35I don't normally post Fibonacci's because they cloud up my charts but GDX appears to have made a beautiful bounce off the .618 fib line.
I went long DEC $34 calls, already up +15% but my PT is $35 in the near term.
A lot of bullish option flow for GDX/GOLD in general, I also have IAG shares doing nicely.
Whatever your strategy preference, I think it's a good idea to get long Gold for near term upside.

GDX looking for higher lowGDX have been so beaten for so long, and every previous attempt was not ready for that consolidation nor higher low. After a recent and decent break above the 55EMA, the Gold miners GDX ETF is retracing hard (as expected) and is now looking for a higher low, in about a week or two.
And with that, then we know the next run would be more robust.

Will Jerome Powell Bury Gold Miners?The VanEck Gold Miners ETF has had a countertrend rally this month, rebounding from a 17-month low. But now could be the time sellers return.
The first pattern on today’s chart is the $33.25 price zone. GDX bounced at this level in November and July. It marked the high in early September and seems to be resistance again this week.
Next, stochastic has been in an overbought condition. This reading also marked tops in May, August and September.
Third, consider upcoming events like the Federal Reserve meeting and non-farm payrolls next week. Those could potentially boost interest rates and the U.S. dollar, which may be negative for precious metals.
Finally GDX is forming an inside week, a potential sign of its recent bounce slowing. This pattern also occurred at tops in August 2020 and May 2021. (See below.)
TradeStation is a pioneer in the trading industry, providing access to stocks, options, futures and cryptocurrencies. See our Overview for more.

GDX DailyAccording to technical analysis, gold and silver stocks appear to be preparing for medium-term growth.

GDX SHORT SWING TRADE | GDX | SHORT @ 31 - 30 | TP @ 29, 28, 27, 26, 25 | SL @ 33 | PATTERN = DOUBLE BOTTOM BREAKDOWN |
PNF chart on the hourly shows a breakout, DOUBLE BOTTOM BREAKDOWN
The strategies I use involve a mix of PNF and Renko. My type of trading is strictly swing trading.
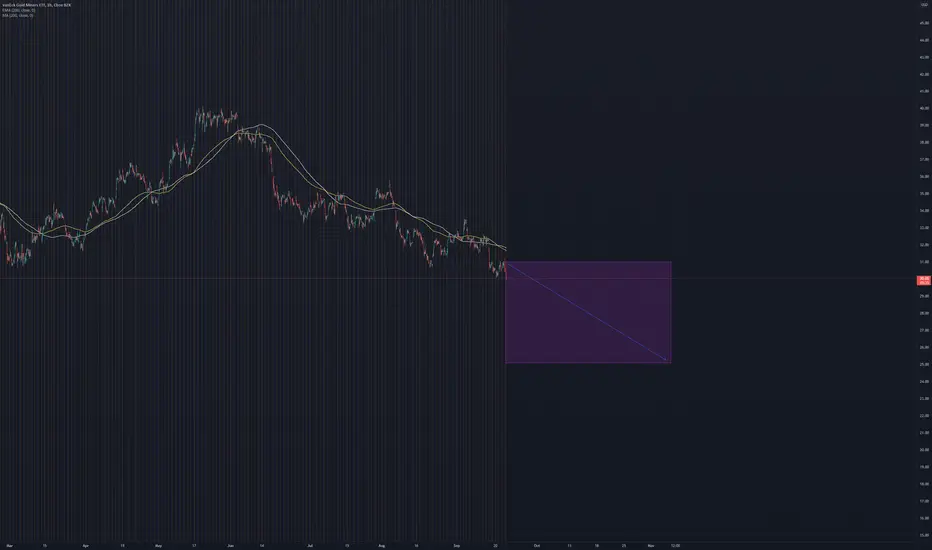

Speculating PatternIt is clear that Gold has been on a steady bear trend.
From the look of the pattern forming in the daily chart, it appears that the price is raising to form a lower high (purely speculative of course).
I'll need to see some clear lower highs before deciding when a bull trend comes along.
However, over a short period of time, there may be opportunity to catch a bull move.
