GDX trade ideas
time to go long GDXThere is a double bottom that has formed in the GOLD spot price itself.
The best way to play this is GDX in my opinion. This has been sold off heavily and looks to be ready to break the downtrend with the combination of the double bottom in the gold bullion prices that will allow the miners to have even more pricing power in this inflationary time.
I'd also include Cathie Woods ARKX space etf has had a historic launch with massive inflows. There will be more demand for gold with the space components needed to explore the next frontier. If you analyze the underlying holdings of ARKX, it is very intriguing. A lot has to do with the actual manufacturing of the spacecraft. Only a small position in SPCE.

GDXWe are above 50DMA and we just broke out of a parallel channel. 0.5 Fib. Ret and original Pitch Fork show $38.57 next resistance price. Good luck


Great Technical Bounce from previous supportyep, watch the gold as USD is acting up. SPX and other indexes will need more direcrtions. Watch PCC for reference to take profits.
GL trading!
No FOMO :)

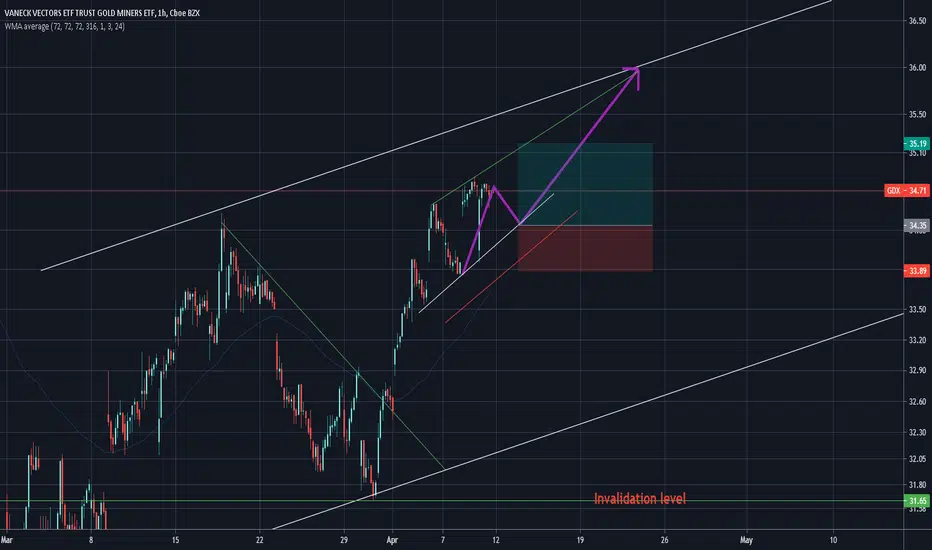
GDX Elliott Wave View: Showing Corrective BounceShort term Elliott wave view in GDX suggests that it is doing a recovery from March 03, 2021 low in a corrective structure. The internals of that bounce is unfolding as Elliott wave zigzag structure where the first leg of the bounce ended in wave A at $34.48 high. Down from there, the GDX made a 3 wave pullback in wave B with another lesser degree zigzag structure. While the lesser degree wave ((a)) ended in 5 waves at $31.91 low. Wave ((b)) bounce ended in 3 swings at $32.96 high and wave ((c)) ended at $31.65 low thus completed wave B pullback.
Afterward, the ETF is trading higher in the next leg higher within wave C. The internals of the current bounce is unfolding as an impulse sequence where wave ((i)) ended at $32.79 high. Wave ((ii)) ended at $32.42 low, wave ((iii)) ended at $34.59 high and wave ((iv)) ended at $33.83 low. Near-term, as far as the pivot from $31.65 low stays intact then GDX is expected to take the extension higher in wave ((v)) towards $35.47- $37.83 area higher. Before it ends the cycle from 03, 2021 low in a zigzag structure & consequently the correction against the cycle from January 05, 2021 peak.

GDX PrimedTook this long this morning risking vs 31.65. Combined effects of infrastructure bill - copper + pm spend, as well as inflation, help this industry tremendously in terms of commodity prices. On top of that, we made a higher low recently which is technically bullish. TGT 40 for me on this for $1.35 of risk.

$GDX looking constructiveReally like how it held the 31.80 level, strong volume on Wednesday/Thursday. Starting to look good to me.

𝗚𝗼𝗹𝗱 𝗠𝗶𝗻𝗲𝗿𝘀 𝗨𝗽𝗱𝗮𝘁𝗲: $GDX Weekly. Upside CaseHas been in this channel for sometime now. Tested key level in 31s and blue TL. Over 35-36 and we could see a pop into the 40s
$GDXJ $GLD $SLV $GC_F $SI_F $NUGT $DUST $DXY #Trading

Channels Are Deadly AccurateGDX/GOLD slammed into resistance, probable downside incoming, but a very tight fight with very little between both sides.. Not out for the count yet.


gdxgotta jump in at some point eh . I like to use the 4hr ,move stops up and heads up into resistance for the sell

GDX/Gold Pinch PointDescending channel from GDX inception, and an ascending channel from the lows in 2016. GDX has had a strong close into the end of the week, we may see a breakout that will blow our socks off, or we may be left bagholding..
I will be monitoring this very closely as it seems it is all to play for...

Doji Reversal For Gold Investors"A doji candlestick forms when a security's open and close are virtually equal for the given time period and generally signals a reversal pattern for technical analysts. In Japanese, "doji" means blunder or mistake, referring to the rarity of having the open and close price be exactly the same"

can gold and gdx regain bullish trend above 65 day moving averaggold and gdx could regain upward momentum soon.


Green open for GDX? Closing tightly in against the 1yr Ma tends to be followed by price opening above the 1yr Ma, which will inevitably open next week outside the descending channel and could be ultimately very positive for the precious metals

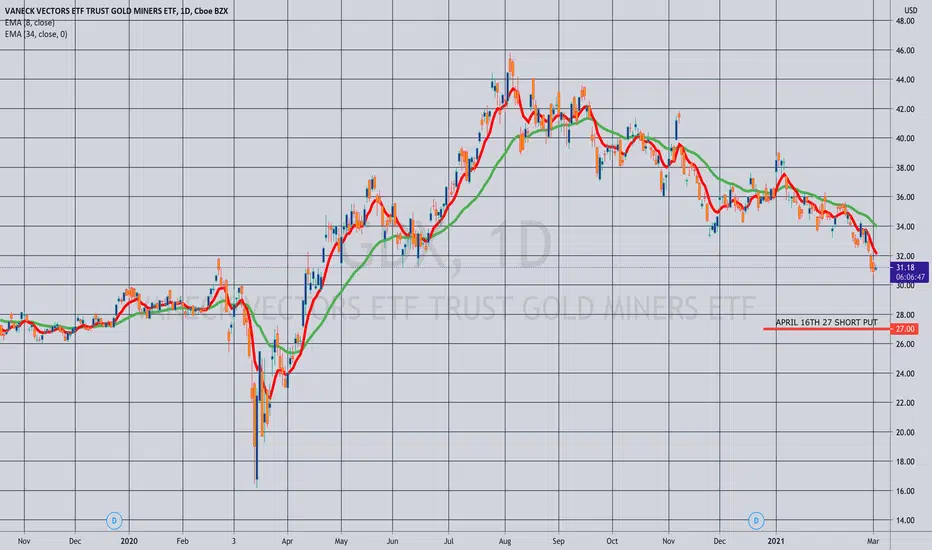
Opening (IRA): GDX April 16th 27 Short Put... for a .42/contract credit.
Notes: With 30-day at 44.5%, adding some miners out in the April monthly on this weakness. 1.58% ROC at max as a function of notional risk; 12.82% annualized. As usual, will take profit on approaching worthless or roll out/take assignment and sell call against if in the money toward expiry (whichever pays more credit).
OPENING (IRA): GDX MARCH 19TH 31 SHORT PUT... for a .60/contract credit.
Notes: With 30-day at 36.7% and expiry-specific at 39.2%, opening a 19 delta short put with a 30.40 break even in the March monthly, since I've already got some on in February. 1.97% ROC as a function of notional risk.
Will run to approaching worthless and/or roll out if in-the-money or take assignment/sell call against (whichever pays most from a credit standpoint).

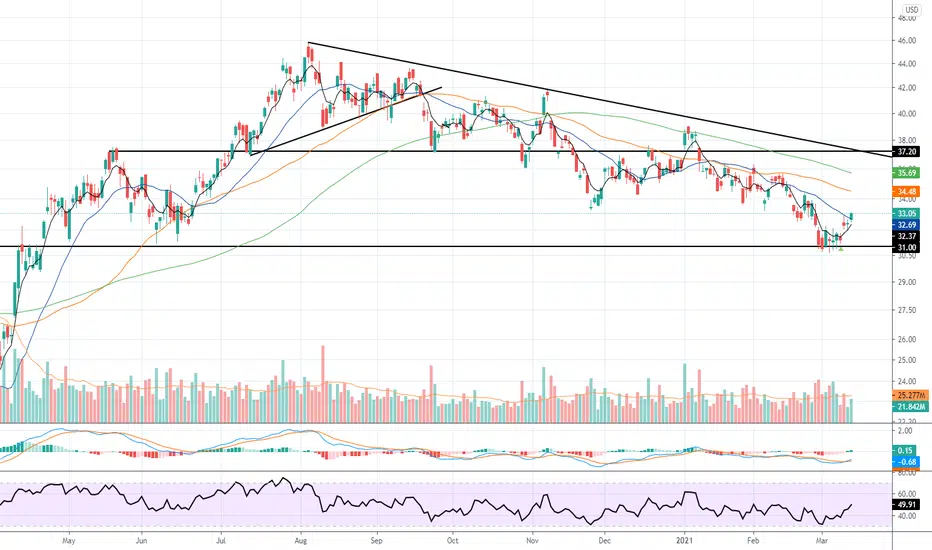
GDX UpdateBounce off the gap from APR21 2020 as expected. Where we go from here will be very telling. A breach of the medium-term down channel and the .786 retracement level will be necessary for confidence, possibly materializing by end-April (29th).
