GDX Chart update November 05The impulse wave seems completed after a very nice pullback of the longer term breakout.
Take profits
GDX trade ideas


GDX stop loss 34 ..looking for a target of 50 to 53GDX stop loss 34 ..looking for a target of 50 to 53
Weekly GDX chart showing .Good Flag forming on GDX which bullish. one need to be patient to accumate ETF at support zone 37 to 34.5 and before finally flag break out happens we can expect rally of 13 to 15 points and hence target 50 to 53...
Volatility is confirmed.. I will be adding 10 to 20% of GDX investment at this level..
76.4 % extension support is around 34.52

GDX is going to hit a critical bottomGDX is going to hit a critical bottom in about 1 week or 2. the target for the next multi-month uptrend target is ~55


GDX I'VE BEEN WAITING FOR THIS$nugt $dust $gdxj $jnug $jdst $slv $gld
Renko is not playable in published ideas so I'll update this chart. My last post got little attention and I've been warning people about a sudden drop in gold, silver, miners. We're setting up a new buying opportunity but how low does it go? I would like to see GDX between 28-32. Hold fast.

GDX going down hardA quick note in the anatomy of the Gold Miners breakdown...
Basically,
the USD is ↗️
the SPX / Equities are ↘️
The Gold Price is ↘️
Miners cannot hold out in such scenarios, and technical breakdown mapped as in chart.


Senior Gold Miners working to transition into bullish quadrantSenior Gold Miners working to transition into bullish quadrant. #patience #gold #silver $slv $gld #fintwit $sil $silj $gdx $gdxj $dxy

Gold Miners Have Been SnoozingPrecious metals surged earlier in the year as Covid-19 hammered the economy. They’ve snoozed the last few months but could now be setting up for further gains.
The main feature on VanEck Vectors Gold Miners ETF is its broad triangle forming since the summer. It hasn’t broken out yet, but is worth watching.
Next, GDX has found support at its 100-day simple moving average (SMA). Meanwhile, it’s trying to fight its way up and above the shorter-term 8- and 21-day exponential moving averages (EMAs). Will the longer-term bullish trend reassert itself against the shorter-term bearish/neutral trends?
Finally, you have intermarket conditions: a weak U.S. dollar . The greenback has paused for the last month as traders waited and hoped for a GDP-jolting stimulus package. So far it’s been elusive, and jobless claims have ticked higher. Meanwhile China is steady and Europe has the potential for Brexit resolution in coming weeks. All of those factors argue in favor of a weaker dollar, which in turn would typically support gold miners.
TradeStation is a pioneer in the trading industry, providing access to stocks, options, futures and cryptocurrencies. See our Overview for more.

GDX - working on a breakout!Still has a bit to go but $40.35 to $40.85 or so will tell us a lot. A break of the downtrend line would be very constructive. Would like to see volume pick up.
The wedge could break this weekMiners have bottomed for the quarter and have already started their next leg up

gdxsure looks like more downside, worth a short with a stop at the top, general markets up into elections and Germany iron fist pushing cashola across the pond

GDX micro elliott count, target 42Should get a micro move to 42, and a more big picture move to around 44, targets still tentative. Not the most clear chart pattern, but Fibb supports seem to be holding. Copyright Rohan Karunaratne 2020


GDX on watch.The DXY appears to be rolling over and the GDX seems to be building some momentum.
Like it long above the box.

GLD Decending Traingle? Swing and a MissBought on 9/16, broke the wrong way the very next day. Looked like a decent descending triangle. Looked like it was just starting to break above the top trend line.
Can someone hlep me with what I missed?
Seemed like the market was moving into Gold to offset some risk.
Had recently had a decent pullback.
It didn't turn out to be a good time to buy. Market went up, GLD went down. Market went down, GLD went down. SELL

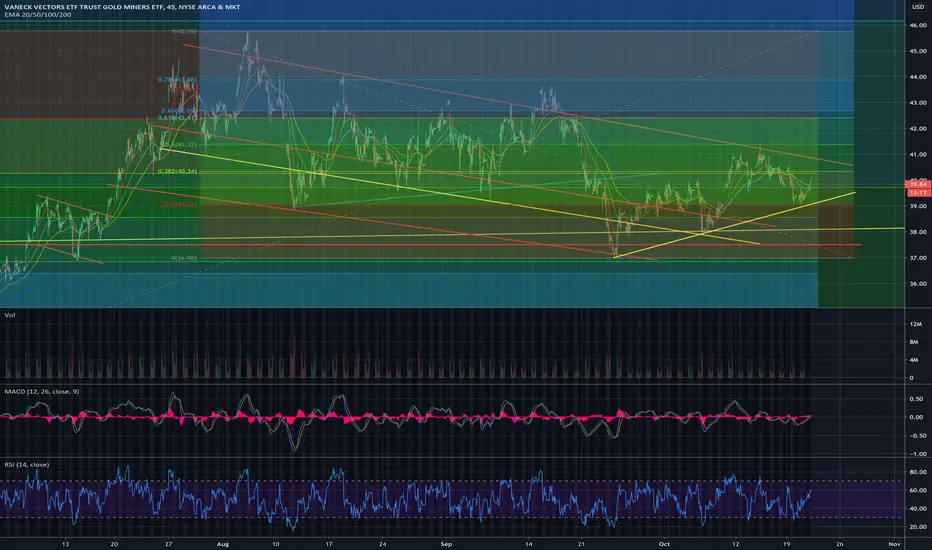
Will the miners offer one more dip?I am wildly bullish on the miners and precious metals over the longer term but I suspect another corrective leg down. GDX has been forming a giant ascending wedge from 2013-2020 and just broke out of that pattern this year. The drop in March was just a small piece of that puzzle that flushed a lot of new & experienced traders out of the trade. I pointed out several times that it was potentially an extremely good buying opportunity. That turned out to be true and the miners have been one of my best trades this year. I'm not an expert on Elliott Wave Theory but I'm seeing what looks like 5 waves up that completed in August. Perhaps now price is still stuck in some type of correction before a much larger move takes place. Take note of the red flag on my lower indicator. There's clearly a trend there and price has not dropped enough to complete another touch. There's no rule that says it must but it's just something to watch. Be patient. Be smart. Do YOUR OWN homework. Follow price. Ignore emotion... and get ready!

the miners are holding up ok -- GDX
Disclaimer, this is only for entertainment and education purposes and doesn't serve by any means as a buy or sell recommendation.
