Gold Miners Buying OpportunityDespite only a 4% selloff we had a 20% drop in Gold Miners what a gift, based on margin calls. The price action on daily charts is already bullish again. Expecting Cup and Handle to play out.
GDX trade ideas

GDX - support zone3/1/20. GDX 4 hour charts
I issued a warning on 2/23/20 of Risk v Reward. At the Friday low, GDX was down a bit more than 20% and NUGT was down a bit more than 50%. I FEEL for all those people who jumped in at the last leg and getting burned but that's how it usually out. Identifying Risk vs Reward and Resistance zone vs Support zone is important.

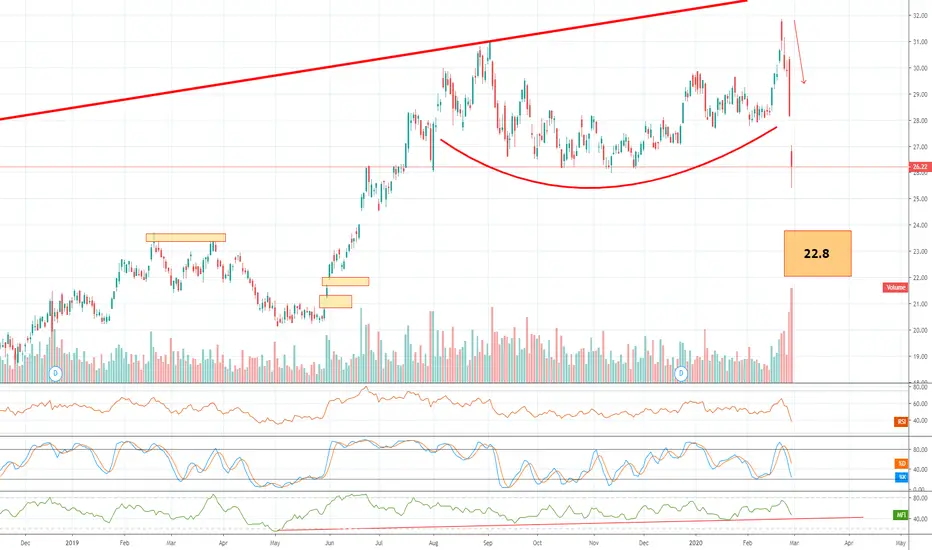
$GDX Bearish signals will drive it down to 22.8 SHORTExtreme bearish indicators supported with bearish candlesticks targeting filling Jun-Gap or 0.62% fib retracemnet
GDX - 3 day chartGDX 3 day chart 2/23/20
GDX is nearing a resistance zone. If GDX stops around 32 - 33 area and pulls back to the support zone then I will likely view GDX has a bull market to look forward to for a long term but if GDX extends to the red line around mid 36 area, then pulls back hard, I would view it bearish for GDX. Until now, it's been a fairly easy ride but it's time to buckle up.

GDX - Support at Control Line?As a follow up to my many GDX posts, it was rejected hard at the 2016 high around 32 and looks to be trading around the low 27's this morning. The selloff is similar to that of 2016 and there is plenty of room to drop into the next channel as GDX looks to find support and build a base. It's counterpart NUGT is around 27 as well with a similar chart having fallen from 43 just a few days ago. Selling seems exacerbated. Not sure what the next move is from here but sidelined myself earlier in the week and waiting for a good opportunity to re-enter. Own DUST until I can pick a spot to go long.


Oh my. Is this all or more to comeHard to play knife catching at this moment. Let's see how it evolves.
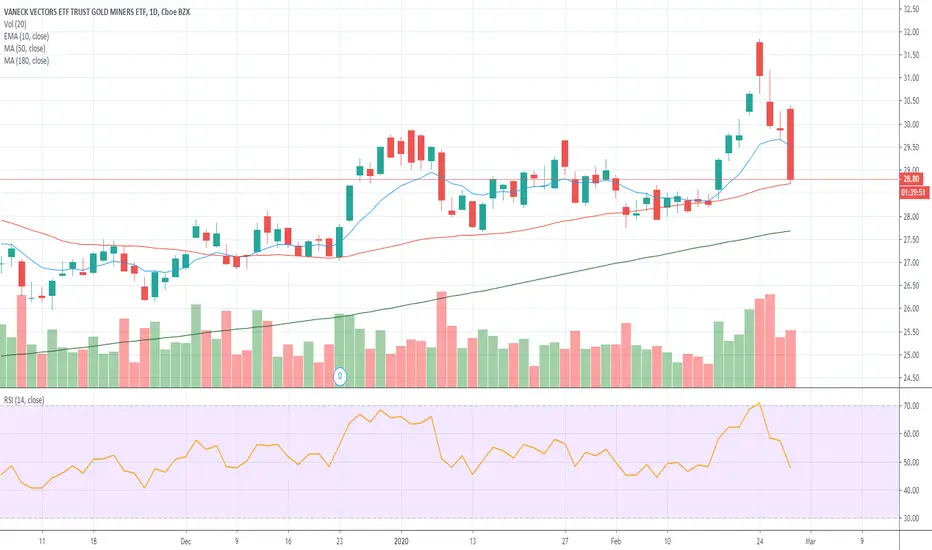
Bouncing OFF The 50 SMAThe 50 day moving average has been this gold ETF's moving average for 3 months; looks like a good entry if it closes above the bounce.
$GDX #Gold miners lagging $XAUUSD by 20% $NUGT $DUST $GLD $JNUGToday's GDX selloff is likely due to an antecipation of a V shaped recovery in the markets.

Definitely has decent downsize risk hereBut I would use 30.5 as the trigger for short term long play. Like the doji on the key line.

Gold Miners Try to Bounce at Old HighGold miners are the classic "safe haven" sector. Not surprisingly, they've moved higher as coronavirus drives pretty much everything else lower.
Market Vectors Gold Miner ETF is the go-to instrument for most traders, with deep liquidity and very heavy options volume. (GDX averages about 140,000 contracts a day, more than triple the runner-up, Barrick Gold , according to TradeStation data.)
GDX has had some interesting patterns on both its weekly and daily charts. On the weekly, it formed an inside candle the week ended February 14, followed by a breakout. That means volatility calmed as prices squeezed, but then it started moving again.
GDX quickly spiked to a seven-year high of $31.84 before pulling back to test the early-January highs $29.70. If this level holds, it would mean old resistance is new support -- another bullish signal.
Remember that GDX rallied hard between last May and August (after years of going nowhere). It then spent six months digesting those moves. The current price action could signal the consolidation is complete and now a continuation to the upside may be expected next.

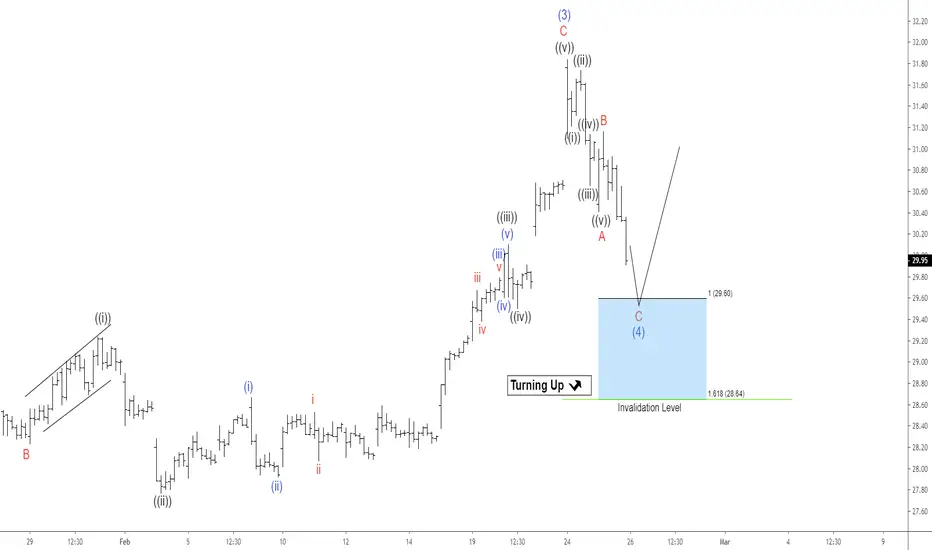
Elliott Wave View : GDX Looking to Extend HigherShort term Elliott wave view in GDX ETF suggests the rally from January 14, 2020 low in wave (3) has ended at 31.98 high. The cycle unfolded as a 5 waves impulse Elliott Wave structure. Up from January 14 low, wave ((i)) ended at 28.67 and pullback in wave ((ii)) ended at 27.92. The ETF resumed higher in wave ((iii)) which ended at 30.10. After that, wave ((iv)) pullback ended at 29.50 and the final leg wave ((v)) of C ended at 31.98.
Currently, the ETF is correcting that cycle in wave (4). The correction is unfolding as a zig-zag. Wave A of (4) has ended at 30.41 and subdivides in lesser degree 5 waves. Wave ((i)) of A ended at 31.10 and wave ((ii)) ended at 31.74. The ETF then continued lower in wave ((iii)), which ended at 30.66. Then, the bounce in wave ((iv)) ended at 31.14. The push lower in wave ((v)) ended at 30.41. From there, the ETF then bounced in wave B, which ended at 31.16. Potential area to end wave C of (4)) is 100% – 161.8% Fibonacci extension from February 24 high which comes at 28.64 – 29.60 area. From this area, GDX can then extend higher or at least bounce in 3 waves.
Gold ETF (Long Term Trade Idea)This trade idea goes hand in hand with my previous trade idea of the stock market. Technical analysis is showing signs that the stock market may be nearing the end of its historic bull run. This chart of gold provides further support for this position. Smart money has started taking a more protective position and this is showing in the chart of gold. The second golden cross is a very strong signal that there will be a continuation of strength that could last years. My recommended trade on this ETF would be to buy into a break of the previous peak at $30 for a target of $50-$60.

GDX back at the April 2013 gap down for the 4th time. Nearly back to the April 2013 gap down of 32.20 for the 4th time. Once the gap is filled and moving up price should take out that 2013 drop rather quickly and head to 40 for starters. Gold is also in month 18 of its current 21 month cycle. These 21 month cycles have been pretty regular since 1999. Enlarge to a 9-10 yr chart to view the big picture.

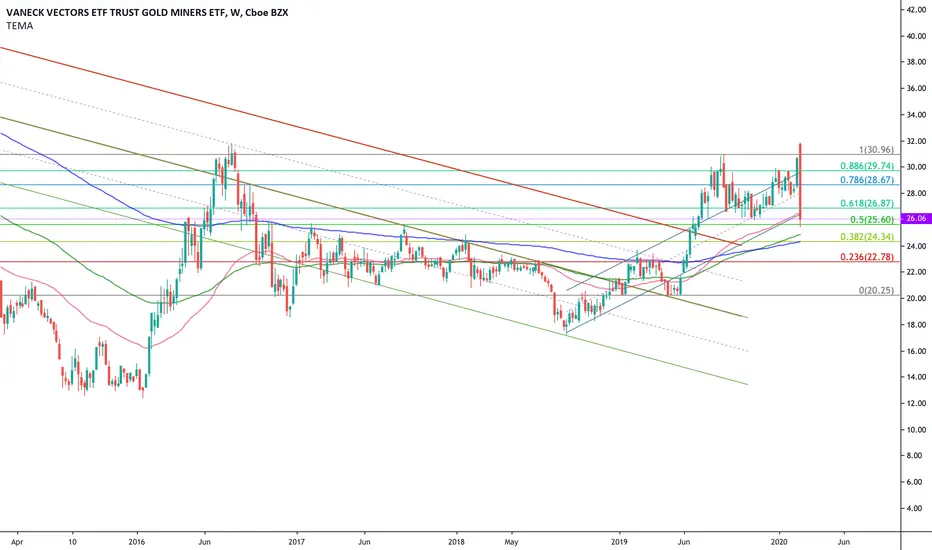
GDX Weekly, 31 - 32 zone break out For GDX, a break out above the 31- 32 price resistance zone is take off for the senior miners, will be a bullish trend release going back to early 2013, when the bear market go serious shape


Gold Miners in a dual pattern breakout - Rally Alert!Just building up, the GDX Gold Miners, which were lagging Gold prices for a while, is now on the verge of a breakout... from a tilted Cup & Handle Pattern, as well as a Triangle.
MACD and OBV are bullishly supportive, and momentum is strong.
A breakout sets an upside target of 32.50.
Enjoy the ride!

Gold miners - laggards in a rallyGold is rallying very hard, and the GDX Gold miners ETF is lagging behind. It is only a matter of time before it catches up, and is already beginning that catch up journey. This morning, it is up 1.5% and launching off, after a higher low bounce off a support region (grey box). Technicals are supportive, as is correlation to Gold prices. The MACD crossed up after consolidation. By next week, it should be breaking out over the trendline, and upside is >15% to target.


Shining Gold Miners02/21
Gold miners are ready to shine when crossing final line 30-31. Double Cup-with-handle patterns are solid foundation for potential long uptrend.

GDX = still working...To take out 2016 high and September high. Clear breakout of the flag and held coming out at halfway of channel. Looks like it may need a little breather if its gonna push higher. Gold and NEM trading at multi year highs. RSI and MACD favorable. Moving averages looking good. Core portfolio position. Hang on!
