GDX trade ideas

GDX (50/50)I would use 27.66 as the reference trigger to the long side. 26-26.5 is absolutely important to hold. Immediate downside risk is still relative big.

gdxdaily support and weekly support, if it were easy we'd be rich and not here ..... Armstrong says one more drop to support needed , 1310, whatever, backtests are healthy if not then blow off top and over. Drills still turning , money still being printed. Prophecy drilling in bolivia with nov results, seems Bolivia miner friendly now as nuag explosion smells of a gig.... Gran colombia selling assets to fund explor and not dilute, pcy setup to fund project with spinoff/sprott, bonterra still spinning holes, what's not to like ...


Intraday weakness on GOLD- Spotted a potential short opportunity on GDX as SELLING pressure had gradually increase
- No sign of demand for the time being

GDX worth longGDX worth a long above 27.5. Stop at 27.3.
Bigger picture wise, GDX is running out of time. At the minimum need to hold 27.5. Otherwise, 26 is the next test. Between 27.5 and 28 means next week is good chance for long. Above 28, pretty bullish then.


GDX - Final divergenceI think the GDX rally is done too.
All the indicators are showing divergencies in GDX.
It rallied almost to the 2016 highs...
We will get a pinbar ( inverted hammer or shooting star ) on the weekly chart.
The weekly chart's indicators need to tag the oversold territory in this decline.
It might close the gap at 24 -24.56 or might test breakout at 23.67$.

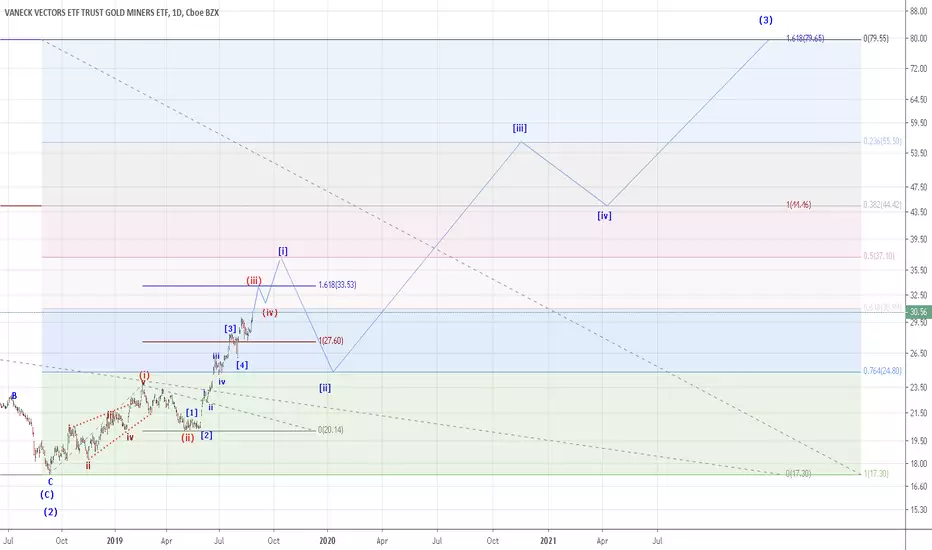
GDX November Low, confirmed signal from weeks ago.This gdx low for November is confirmed and the previous forecast for a gold high in Oct has not been invalidated and was not nearly as strong as the GDX signal was and is now.


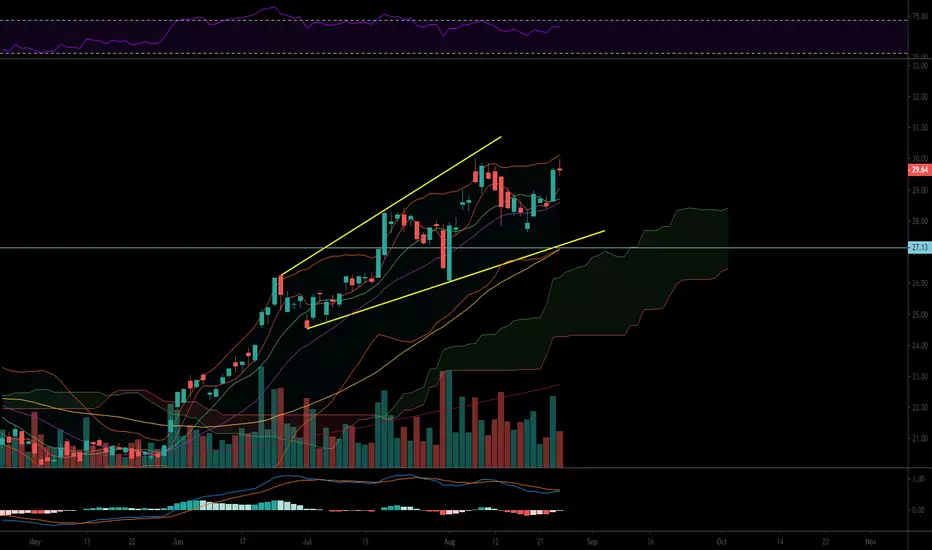
GDX reviewDaily not beautiful but closed above 29.6 key line. Weekly has shown some level of concern but one more day to go.
Anyway, watch if 29.6 can hold. If b/d, 28.85, 28.28 should support.

$GDX - never long resistance Precious metals are doing good but one of the fundamental rules of trading is buy at support, sell at resistance, not the other way around so I am looking to wait before I enter $GDX here.


Up or wait one more dayI actually like this doji. Can chase once it b/o 30. Lower low on daily would see support at 28.85, 28.5 & 27.76.
Uptrend continues...Above 29.6 will go higher. Profiles show the uptrend is not done yet. And do not see much resistance to pass 2016 high.

GDX; Amazing buying opportunity EP1: 28.80
EP2: 29.90
SL: 27.5
Scale your position based on Entry price, Stop Loss would be at breaking the trend line.
