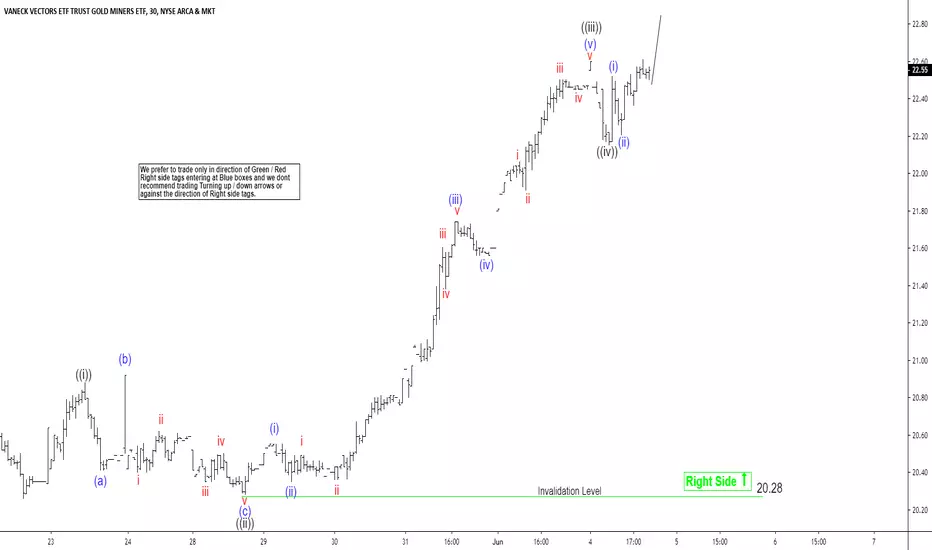
Elliott Wave View: Impulsive Rally in GDXElliott wave view in Gold Miners ETF ($GDX) suggests the pullback to $20.26 ended wave (2). Wave (3) is currently in progress and the internal subdivides as an impulse Elliott Wave structure. Up from $20.26, Wave ((i)) ended at $20.88, wave ((ii)) ended at $20.31 and wave ((iii)) ended at 22.60 peak and wave ((iv)) ended also at 22.16.
We can see from the chart below the internal of wave ((i)) and ((iii)) also subdivide as an impulse in lesser degree. We don't like selling $GDX and expect buyers to appear in 3, 7, or 11 swing as far as pivot at $20.28 low stays intact. In larger time frame, if $GDX can break above Feb 21 peak ($23.70), then it should create a bullish sequence from Sept 11, 2018 low opening up more upside.
GDX trade ideas

GDX: Weekly trend activeI like the chart in precious metals and miners as of late. Given the weakness in equities and the options data favoring a decline, I think buying into gold and silver mining might pay off.
The $GDX chart shows a weekly Time@Mode trend signal confirmed last week, you can see the boxes that detail the targets it can reach if it doesn't fall below the stop loss on chart.
Individual stocks might offer more or less interesting trade setups as well, but the sector ETF is already a good enough proxy for this trade.
I leave you with the due diligence required to find good in individual stocks that might rally with this sector here.
Best of luck,
Ivan Labrie.

Gold Miners - Push Up Incoming Welcome back guys, sorry for disappearing for a while, I’ll be post more frequently after June!
But in the mean time… here’s what I’m looking at right now.
First, let’s acknowledge that trading gold miners have been pretty boring lately given the tight range it’s been stuck in. That’s why I was primarily day trading for the past month to avoid taking overnight risk, aka the battle between negative macro news and Trump trying to bring the sentiment back up by tweeting.
Now if you look at the GDX chart, you’ll see that the past 31 days have been forming a symmetrical triangle pattern, meaning a lack of trend either up or down. However, this type of pattern usually represents a large move to either side is highly likely, since large players have been likely accumulating or dumping shares throughout this flat period.
This time around, I’m betting that it breaks to the upside. The reasons are as follows:
Potential catalysts for Gold and Gold Miners:
1.) GDX is showing very strong upward momentum on the Money Flow Index, which is similar to the RSI except adding in volume. It’s showing that even though prices are not trending, buying pressure is increasing. I see this as bullish in the short term.
2.) Macro news will likely remain negative when considering the EU, therefore positive for gold
a. May has to step down, speculation is betting on the next leader to be tougher about Brexit. High potential for an exit without a trade deal to minimize economic impact.
b. Economic growth will not likely show a strong reversal anytime soon, given that negative interest rates have done very little to spur growth so far.
3.) Macro news in the US will most likely be neutral.
a. Trump will most likely continue to tweet positive hope for deal. He has to calm the markets at least until he’s re-elected.
b. Labor market is still showing increasing tightness. However PMI and new home sales have been failing to meet expectations.
c. Next round of corporate earnings will not likely be as easy to beat as this first quarter. Since expectations were set extremely low.
4.) Market sentiment has been tough to break recently. With money flowing in to buy up the gap downs. Mainstream media is usually a good place to judge how the general public is feeling, and usually you should be looking for confirmation of the opposite direction of whichever way the news is saying the market will go. Right now I see some positive and some negative, leading me to believe the market will continue to be choppy with no clear direction, which is bullish for gold since uncertainty will maintain a support for safe haven assets.
5.) M&A activity picks up, bullish for miners. (This is probably not likely to happen any time soon, just fun to think about)
a. An increase in M&A activity could draw investor attention to this long forgotten sector.
All in all, I’m currently long miners with a healthy position in $NUGT. Placing my stop-loss a little more than half a percent below the nearest support. There might be a final push down by the big players to gather liquidity in order to make the breakthrough push upwards.


GDX: long till 25-26We had the cycle low at 30. April and we should start soon rising to 25 Region. Later on 22...

Double bottom forming in Gold Miners $GDX50 EMA crossing down over 200 EMA, 20EMA crossing down over 50EMA - $GDX (Gold and the miners) are going down from here. TTM Squeeze on daily chart so this should be a big move.
$GLD $GDXJ $NUGT $JNUG $SLV $JDST $DUST
However - since 200ema is flat and double bottom forming on the chart - this week would be a good time to buy back your calls and sell puts. Since this is a daily chart and the move looks large you could buy a straddle at the end of this week.

Trap is set $GDX Miners about to move Reason's $GDX is about to make a move
Volatility is coiled - Bollinger Bands have retreated into the Keltner Bands
Trend is flat to down on the weekly, daily and hourly chart looking at the 200 EMA
20EMA crossed down over the 50EMA
Price retraced to 20EMA
My suggestions:
1. Sell Calls
2. Buy Puts (if the premium is there)
3. Sell Spreads
4. Buy 3X ETF and buy a put to make a collar
There will probably be another piece of news that the trade deal will get better and gold will get smashed down.

$GDX (Gold) Going LowerIf there isn't a disaster in Iran within the next few weeks - gold will be going lower. TTM Squueze is coiling on 15 minute chart, 1 hour and 4 hour. The daily chart shows the price testing the 20 EMA after crossing over the 50 EMA which is a bearish signal. I would buy puts now or sell calls and buy them back in 1-2 weeks.

Break in range soon,Anticipating bullish move if daily resistance in major indices and dollar continues. If major indices break their daily resistance, easy move to 20 is in the cards. Option chain is bullish at 0.18.

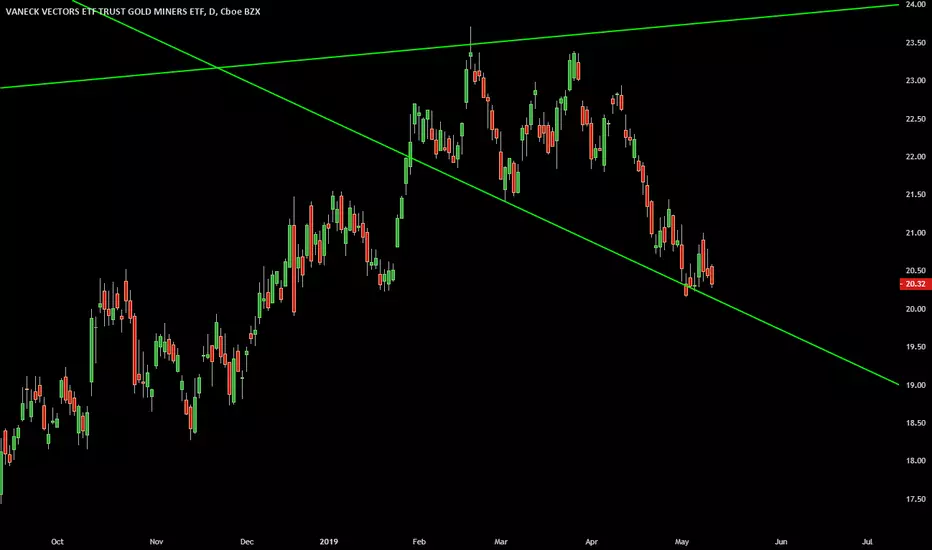
Vaneck Vectors ETF: Medium term sell opportunity.GDX has printed a Death Cross (MA50 crossing below the MA200) on a similar trading pattern as in 2016. The RSI price sequence is also identical, indicating that at least one more bearish sequence is due. With MACD turning at -0.277, it is an optimal opportunity to short. Our TP is 19.00.
** If you like our free content follow our profile (www.tradingview.com) to get more daily ideas. **
Comments and likes are greatly appreciated.

Jun 21 - GDX - Bear Call SpreadGDX 21-Jun-19
IV30: 22.1, IVR: 41%, ATMIV: 22.9
+0.31D Long 1 Call: 22 Strike @ $0.35
-0.51D Short 1 Call: 21 Strike @ $0.72
-0.20D Credit: $0.37
PCR: 43:57
Comments:
GDX is starting to sell off (RSI<30) on weekly chart. Expecting price to stay below 21 for atleast next 2 weeks.


GDX - Gap closedDespite the good NFP data gold is bouncing.
If you watch closely the GDX chart yesterday we broke below an important support of
20.25. As of today it should have become a resistance instead of a back test we are above 20.25 again.
In my books it's a false breakdown.
We not just closed the gap but broke below the 200 SMA.
The chance is extremely high that the miners bottomed yesterday.
One can wait for a close above the 200 SMA with the buying, but with the RSI divergence and the MACD close to cross over I'm buying here.
If a rally is beginning here it might be legendary.


$XAUUSD $GDX 20% pop to year end - BARRONSbarrons.com/articles/gold-could-rally-by-20-in-the-second-half-51556875802

GDX - Metals Trading | Elliott Wave Structures I Q2 2019*If you like this idea please support it with a like so I can publish more. Thanks!
More details about me in my signature.
GDX - Elliott Wave Outlook
Bullish Swings - Patterns:
ABC swing in Intermediate (A) (green
Simple Correction in Intermediate (B) (green)
Ending Diagonal in Intermediate (C) (green)
Bearish Swings - Patterns
Sharp Bearish Impulse in Intermediate (A) (light blue)
Simple Correction in Intermediate (B) (light blue)
Ending Diagonal in Intermediate (C) (light blue)
Bullish Harmonic Pattern
Next expected swing:
Bullish leg in an attempt to reenter the Channel.
Structure change:
A breach on the down-side in an impulsive manner could lead towards a down-trend confirmation for Precious Metals.


GDX 5 Wave Up? Watching how GDX reacts to $20.50-$21.30 level to see if it can move up on 5th wave in the medium term. Long-term chart is quite confusing. Wave 2 looks quite complicated, has potentially to not be done and retrace almost all of Wave 1. See how it performs in the Med term to see which way it will go.
The metals (GC, SI) are pulling back which can coincide with GDX's move back down to $20.50-$21.30 and then keep moving up

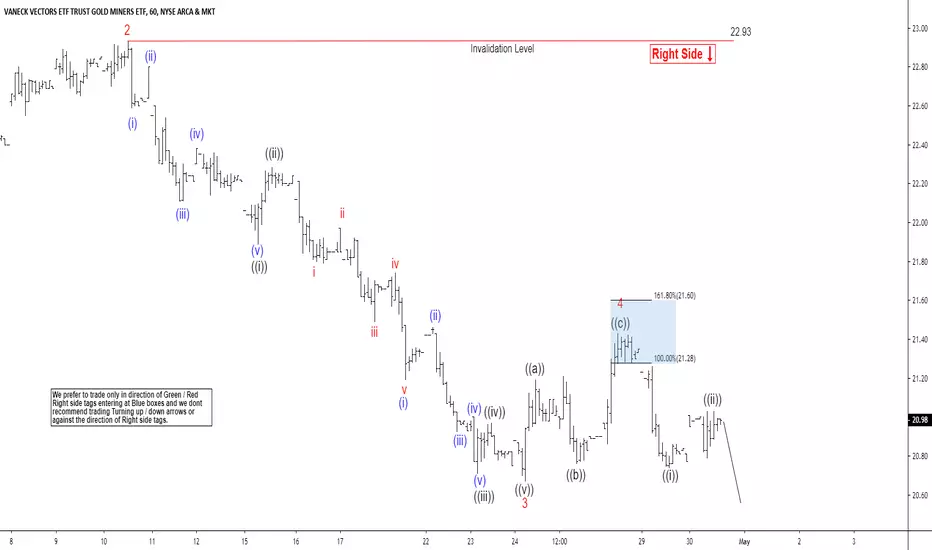
Elliott Wave View: More Weakness in GDXElliott Wave view calls the decline in Gold Miners ETF (GDX) from March 27, 2019 high ($23.40) as an impulse structure. In the chart below, wave 2 of that impulse ended at $22.93. Down from there, wave 3 ended at $20.67 and wave 4 ended at $21.43. The miners still need to break below wave 3 at $20.67 to validate the view and avoid a double correction. The internal of wave 3 subdivides as an impulse Elliott Wave structure of lesser degree. Wave ((i)) of 3 ended at $21.89 and wave ((ii)) of 3 ended at $22.29. Down from there, wave ((iii)) of 3 ended at $20.71, wave ((iv)) of 3 ended at $20.97, and wave ((v)) of 3 ended at $20.67.
Wave 4 bounce unfolded as a zigzag Elliott Wave structure. Wave ((a)) ended at $21.19, wave ((b)) ended at $20.76, and wave ((c)) of 4 ended at $21.43. Near term, while bounce stays below $21.43, and more importantly below $22.93, expect the miners to extend lower. Potential target to the downside for wave 5 is $19.6 – $20, which is where wave 1 = wave 5.
GDX -Waiting for a buy setupWe are getting closer and closer to an important buying opportunity in gold miners.
Though yesterday we almost tagged the 200 SMA and bounced I still don't see that buying opportunity what i like to see at the gold miners bottom.
At the beginning of today's trading we broke above yesterday's high which is usually a buy signal but after a few hours of trading we gave back all the gains and closed in the red.
I think we are quite close to the bottom in days - 4-5 days only - but these last few days can be extremely scary as we print the cycle lows.
First of all I dont see the volume spike what usually occurs at these intermediate bottoms:
The other thing that we stiill have a gap between 20.5 and 20.8 which pulling down price like a magnet:
Today was the 5th day since we broke below an important level at 21.41 and usually these breakdowns lasting for 7-8 trading days:
Today was day 5 of the breakdown.
So I would wait with the buying till next week in the miners as we might have 3-4 red days ahead in the upcomong trading sessions.
