Golden opportunity?Most ‘experts’ are declaring the gold cycle done
I agree it’s at a possible reversal zone
But given my analysis that the dollar has not bottomed
And looking at the bigger picture for gold and miners
This could be an opportunity to buy into strength
This next 24 hours are key for gold and miners
GRI 2023
GDX trade ideas

GDX Dips Likely to Find Support in 3, 7, 11 Elliott Wave Swing1 hour chart of Gold Miners ETF (GDX) below shows that the pullback to 27.54 ended wave (2). The ETF has since extended higher in wave (3). Internal subdivision of wave (3) is in a 5 waves impulsive Elliott Wave structure. Up from wave (2), wave ((i)) ended at 29.32 and pullback in wave ((ii)) ended at 28.12. Then the ETF rallied higher in a nest. Up from wave ((ii)), wave (i) ended at 29.99 and dips in wave (ii) ended at 28.41. Wave (iii) ended at 31.98 and pullback in wave (iv) ended at 31.26. Final leg wave (v) ended at 32.75 which completed wave ((iii)).
Pullback in wave ((iv)) is ongoing as a zigzag where wave (a) ended at 31.94 and rally in wave (b) ended at 32.65. Wave (c) lower is expected to end soon which also complete wave ((iv)). Afterwards, the ETF should rally higher in wave ((v)) before ending wave 1 and cycle from 12.20.2022 low. GDX should then pullback in wave 2 to correct the cycle from 12.20.2022 low in larger degree before the rally resumes. As far as pivot at 12.20.2022 low (27.54) remains intact, expect pullback to find support in 3, 7, or 11 swing for more upside.

Gold miners have underperformed the major indices since 2011Historically, gold and gold related stocks dont do well until the money supply needs to be expanded. When the central bank decides they need more printing and more debt, they devalue the dollar and tax the holder of currency.
US debt and m2 is so large relative to the GDP, the central banks will need to relieve the bottleneck of money and increase money supply.
Book recommendation: Currency Wars by Jim Rickards.

Cup and handle breakout, in strong seasonal period for goldAnother 1.4 trillion in government spending just passed. USA spends like a drunken sailor. Debt to GDP about 115 %. Gold and gold producers in a clear breakout now. I suspect gold will be a good place to be for 2023, even with another rate hike. Markets are forward looking.

GDX coiling againIt has been a while since it would be even worth to look into GDX, and I think it is about time... still early, but good to plan ahead and see if it is working out as projected.
GDX (Gold miners) mounted a good recovery but stalled on a trend line and retracement is likely to see 27, else 25.
The technical indicators (MACD and VolDiv) are turning bullish, but not just ripe yet. Expecting a higher low about 25-27 (red ellipse is the optimistic target; also the 62% retracement level) in early to mid January 2023. Bouncing off the 23-week EMA would be a good indicator that the projection is in line.
So... being optimistic for a comeback, but until the pullback is apparent, sitting on my hands first.
Happy Boxing Day!

GDX PullbackI'm looking for $GDX to pullback to that $24.50-$26.50 level for a long position. I think this could see $33 again according to the monthly time frame. Daily is shown here. Monthly Trix is green and momentum has shifted. Also, the $DXY has fell to a very heavy support level and should get a bounce which will bring gold down.

All I Want for Christmas is a Fed Pivot...Markets are pricing in a recession by 2023 year end. Many believe the fed has overtightened and financial conditions will kill growth. Less spending, lowering earnings and less jobs. In today's market environment an environment a recession is actually bullish for equity markets. A recession would bring down aggregate demand and inflation. This would allow the fed to revert the economy easy monetary policy and markets will price in interest rate cuts. In this scenario, we would see an increase in growth stocks, Bonds, Gold, EURO, Semis...etc.
On the contrary, there still remains the upside risk of inflation being more persistent than expected due to a more resilient US economy. economic growth in Q4 is ~ +3.5% and consumers are still strong. The savings rate is at an all time low signifying that stimulus is still in consumer's wallets.
So are you expecting a recession or will we stay with tightened conditions. The above chart shows where price will gravitate towards under the two scenarios.
1. The first chart shows the US10Y with XLE(Energy) overlaid. A recession would lead to lower growth prospects decreasing both XLE and US10Y. On the other hand, a high inflation environment would mean that energy prices would rise due to more steady demand and yields would price in the accompanied economic growth.
2. Next we will take a look at the Dollar. A recession would be very bearish for the dollar due, to US treasury not paying out as much for those holding dollars. This would allow the EURO to increase.
3. Gold does well whenever real interest rates falls. Like when there is a recession.... If higher inflation is here to stay, real interest will increase as, the fed attempts to slow economic growth further.
We have entered an environment riddled with moderate inflation. The last 10 years, Tech boomed. In the next 10 years, commodities will. I see the US economy's increased resiliency and higher than expected growth to be the reason rates stay high leading the fed to tighten more. I am looking for 4.5% - 6% on the US10Y. But, everyone is pricing in a recession by Q4 2023. Leading to the decline in US10Y (long bonds) and the dollar. A lower dollar increases prices of commodities and lower rates make for easier economic conditions. The exact opposite things we need to bring down inflation. The fed pivot narrative is stimulating the economy, leading to more inflation. So, maybe the US10Y goes down a bit before going to 6%???? or it goes up a bit before going to 3%???? This a very confusing market so, I urge you to tread carefully and only invest in what you understand. I can't see the future, I observe the clues the market gives me, manage risk and hope for the best.....
Saving rate:
Dear Santa.....
All I want for Christmas is a Fed Pivot... Please?

GDX Gold Miners BullGDX chart on the 1D and 3D time frame.
-Miners look good here, imo. 1D 13/48 MA cross, but not yet on the 3D. Five waves down watching for big impulse here.
-Price has touched back on $27 possible head and shoulders trendline.
-On 3D price has breached downsloping trendline
None of this should be interpreted as financial advice, I am not a professional or certified financial adviser! all charts, and or analysis' are my personal opinions and observations only!

More upside on Gold and Gold ETF While Gold fell yesterday due to interest hike fears and China's economy.
I believe the Gold still has more upside.
Currently, looking at gold miners ETF. Believe that it might fall to support level ($26 area) and bounce back higher.
Aiming for around the $ 30 area..
However, should it break $26, I will exit my trade.

Elliott Wave View: Gold Miners (GDX) Starts a New Bullish CycleShort term Elliott Wave View in Gold Miners ETF (GDX) suggests it has started a new bullish cycle from 10.13.2022 low. The rally from there is unfolding as a 5 waves impulse Elliott Wave structure. Up from there, wave 1 ended at 25.4 and dips in wave 2 ended at 22.58. The ETF extends higher again in wave 3 towards 28.49 as the 45 minutes chart below shows. Internal of wave 3 unfolded as another 5 waves in lesser degree. Up from wave 2, wave ((i)) ended at 27.02 and pullback in wave ((ii)) ended at 26.05.
ETF extended higher in wave ((iii)) towards 28.48, and dips in wave ((iv)) ended at 27.88 as a triangle. The last leg higher wave ((v)) ended at 28.83 which completed wave 3. Pullback in wave 4 ended at 26.76 with subdivision as a zigzag. Down from wave 3, wave ((a)) ended at 27.57 and rally in wave ((b)) ended at 28.09. Wave ((c)) lower ended at 26.76 which completed wave 4. GDX has rallied higher again in wave 5. Up from wave 4, wave ((i)) ended at 28.40 and dips in wave ((ii)) ended at 28. Expect the ETF to extend a few more highs before ending wave 5 of (1). Afterwards, it should pullback in wave (2) to correct cycle from 10.13.2022 low in 3, 7, or 11 swing before the rally resumes.

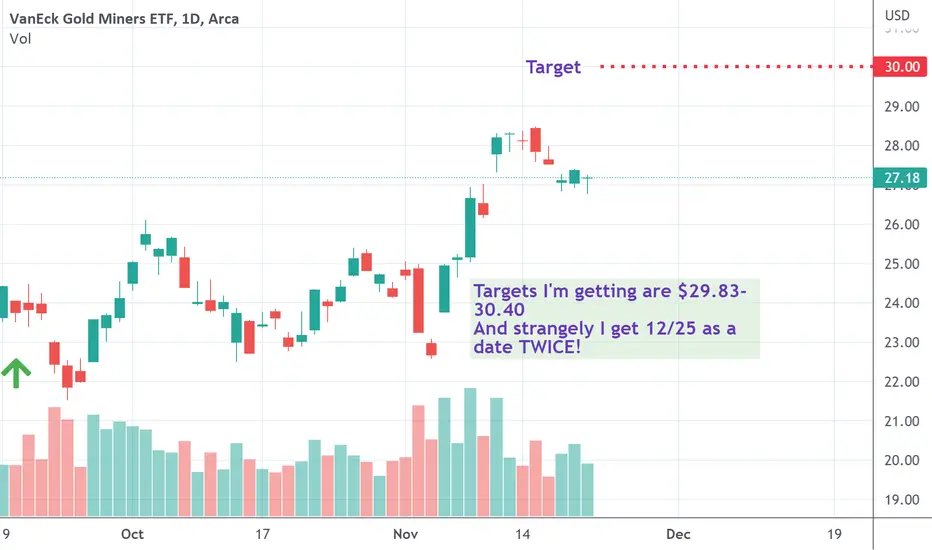
Entry for next leg up in $GDXMy dowsing keeps giving me that there's a long entry in GDX, and that this is a multi-day swing low. I think it's today. There's a nice reversal candle on the day. I forgot that I calculated a target yesterday, so did it again today, but I'm happy to see they are relatively close to each other, $29.83-30.40
And I asked for a date twice as well and got the 25th, which I though was this week. But, I forgot I asked already for a date (yesterday), so asked for the number of days to a reversal on GDX and it gave me 34. That calculates to none other than Christmas Day, 12/25! I actually hate getting dates on closed days, but it's something to be aware of since I got the 25th twice using 2 different methods.
I ask what direction we run up into 12/25 and get "higher".
3M Inverted Chart Is Saying Something? MinersWhat does the 3 month timeframe INVERTED chart tell us about miners?

breakout mode for goldwere in a countertrend daily rally for gold as well as equities, and where theres normally a hedge we see direct correlation to both breaking out. the price doest tend to spend much time outside of the envelope. id imagine one final thrust into sss supply zone before revisiting estimate and lower envelope band simar to ghost feed is in order.

idea- Relief Rally It looks like an incoming relief rally for GDX,
MACD divergence, if this week close above the 11-week EMA in orange we can see the rally at least to around 27.50 or even 28.50(10% to 14% upside)
good opportunity in this chart.
I look to see the price close above the 11 Week EMA, Bottom indicator crossing above the zero line MACD already with a buy signal. The histogram above Zero Line, if I see the EFI crossing above the zero line is a confirmation of the relief rally.
Disclaimer:
This is only my view of the instrument, please carry out your due diligence, this is not advice to buy or sell anything.

GDX - Going Down Xtrenuously (pun intended)The gold miners ETF, GDX, just points to a very very rough time.
With the interest rates escalating rapidly, the USD rising swiftly, the equity markets weakening, and gold prices crumbling... it is a perfect storm for GDX thrashing.
The weekly chart had a tombstone doji the previous week as it failed the Hull EHMA, and the past week confirmed the trend reversal down. The weekly technical indicators are weak and bearish looking so not much to go on here.
The daily chart shows a recent breakdown from a failed 55EMA test. and on Friday, ended with a bearish marubozu, closing near the weekly low. The technical indicators are significantly suggestive... the MACD had actually wasted a long bullish divergence and failed to mount a very decent rally. This failure would have a doubling opposing effect, and the daily MACD has actually crossed down into the bear territory.
Taken together, projections set a downside target of 17, about the end of November 2022.
A very tough time for GDX (unless you are short)

GDX: Rise and Shine! ☀️GDX seems to have woken up and is showing its high spirits by climbing upwards. We now consider wave ii in magenta to be finished, and thus expect the ETF to continue its way above the resistance at $28.83. Once there, GDX should gain even more upwards momentum to rise above the next mark at $40.13 as well. We should still keep in mind our alternative scenario, though, as there remains a 40% chance that GDX could lose its steam and drop below the support at $16.18. in that case, we anticipate further descent.


$GOLD miner ETF a break of descending bear
channel downtrend
suggests move higher to
overhead resistance at 29.00
Stochastics divergence on
recent low suggests $gold
minders ETF should
move higher

GDX gold miner ETF setting up LONGAMEX:GDX
Based on the 4H chart as well as the price action of spot gold
using an EMA ribbon cross-over as well as the volume profile,
I have set up a long trade with two upside targets of about
10 and 20 % upside respectively with a stop loss of about
4% which would be adjusted as soon as the price rises above
$ 27 to move the stop loss to the entry price making for
a breakeven free trade after that. Overall, spot gold
is sitting on support with a bullish RSI divergent pattern.
I also see GDX as a candidate for the intermediate term
call options out of the money about 15% above the current
price being between the two targets.

GDX BUY 20 sell 35NOT TARDING ADVICE
Geometric charting
If stonks bounce so should this
GRI 2022
Bull div

It's Time For Gold/Silver To Make A Big Move Higher (FEAR)We've all been watching Gold/Silver - waiting for the next big move. I think we've hit the bottom RIGHT NOW.
FEAR is going to build over the end of the year as global market concerns continue to elevate. Gold & Silver should continue to rally higher off this Quintuple-Bottom level - or break downward if the Fed is able to navigate a soft landing.
Either way, it's not or never for Gold/Silver.

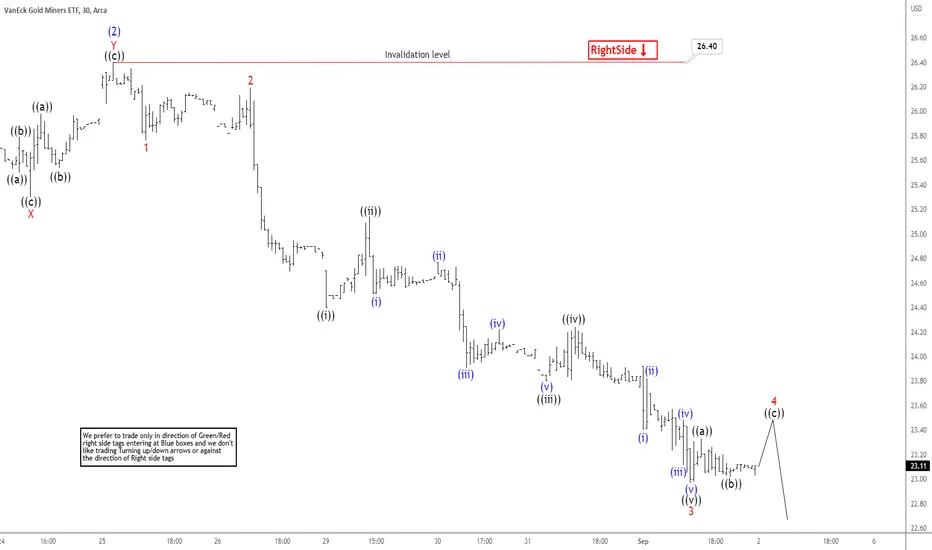
Elliott Wave View: Gold Miners ETF (GDX) Has Reached Inflection Short Term Elliott Wave View in GDX suggests rally to 26.40 ended wave (2). Wave (3) lower is in progress to complete a cycle from August 25th, 2022 high. Internal subdivision of wave (2) unfolded as a double three Elliott Wave structure. Up from wave (1), wave ((a)) ended at 25.23 and pullback in wave ((b)) ended at 25.44. ETF extended higher in wave ((c)) of W towards 26.22. Connector wave X completed as a zigzag correction at 25.30. GDX then resumed the rally in wave ((a)) ended at 25.98 and pullback in wave ((b)) finished at 25.53. Final leg higher wave ((c)) ended at 26.40 which ended wave Y of (2)
GDX turned lower in wave (3). Down from wave (2), wave 1 ended at 25.75 and bounce in wave 2 ended at 26.18. The ETF extended lower in wave 3 towards 22.96. Internal subdivision in wave 3 unfolded as an impulse. Wave ((i)) ended at 24.40 and bounce in wave ((ii)) ended at 25.14. The instrument extended lower in wave ((iii)) of 3 towards 23.80. Then a shallow rally completed wave ((iv)) at 24.24 and last leg lower ended at22.96 completing wave ((v)) of 3. Near term, we are developing a corrective wave 4 and afterwards, it should continue lower to end wave 5 of ((3)). As far as pivot at 26.40 high stays intact, expect any rally to fail for further downside.
GDX vs. BTC still holding uptrendI first published this chart in December last year with the view of owning gold & gold miners over Bitcoin. Whether you took a spread on Gold spot or gold miners(GDX) vs. BTCUSD, either one would have doubled your money this year. It has been a great trade indeed but interesting to note how strong this uptrend has been since the end of last year and there looks like no stopping this gravy train at the moment. In the absence of a technical break, I am still happy to own gold vs. bitcoin for now.
