GDX Interim Bottom?Just as Gold and equities plummeted over the last 4 weeks, GDX was in no way spared, losing at least 25% from 4 weeks ago. An absolutely deep retracement following Gold prices.
Daily candlestick pattern suggest a brief consolidation at current levels, 30-31.
Do not yet see a bottoming pattern... not yet.
GDX trade ideas

GDX at multiple support levels - Buy for long termThis is weekly GDX chart, testing multiple support levels - Channel lows, 200 SMA and long term support trend line. It's a good buy now for a quick bounce and also for long term. Given inflation is going to be hot for few more years, gold and gold miners will shine.

GDX: Gold Miners Geopolitical HedgeThe multi year cup and handle provides good upside catalyst to hedge further geo-political risk. I don't think the Russia/Ukraine war is going to be resolved anytime soon.
GDX is preferred over GLD here because GDX will have positive carry (from cash flows of the miners) and the spot price is high enough to warrant some production. This is a good place to start to build a small position; what I are looking for here is a stronger volume signature as confirmation; but because of the way gold trades (meaning something adverse happens) I would expect the rip up to be very violent and aggressive so it merits building a position now and slowly buying dips. MACD has crossed recently giving us some small confirmation of bullish price action.

GDX: Out of the BlueThis is GDX’s motto only literally because its descent from the blue zone between $43.86 and $39.30 was far from unexpected and indeed completely in accordance with our primary scenario. After completing wave (b) in blue in the blue zone, GDX has established itself on its way downwards, and we expect it to continue this trend into the magenta zone between $27.49 and $19.52 below the support at $28.83. There, GDX should finish wave (c) in blue and wave ii in magenta before rising above the resistance at $40.13. There is a 30% chance, though, that GDX could break through the bottom of the magenta zone and drop below the support at $16.18.

$GDXPutting $GDX on my radar... double bottom, possible C/H, breakout from trendline, now looking to 2020 highs.
AMEX:GDX

GDX In the last week, GDX erased the bullishness of the preceding month with one fell swoop of an Bearish Engulfing kind (weekly chart).
So expecting continued bearish candles would be expected as it follows through.
The daily chart supports that view so far, and it just broke down of the 55EMA, after a gap down. The good thing is that it did not really gap and run... at least not yet.
Technicals are overall bearish, at least for a bit. Expecting bounces off 36, maybe even 35.

GDX still in a uptrendTechnically, the broad PMs sector still look very bullish on the longer run, with the next support on the weekly MA50 and on the falling wedge VPVR, with the next target around 46$. We might find bottom and get ready for a rebound to the previous top in the early summertime. It will coincide with the LME trading desk stopping its activities in junes (like spoofing the PMs?) and around the same time the DXY might be reaching its previous resistance. Short time pain, thats about it...

LONG GDXAMEX:GDX
0.618 of Fib channel level coincides with the completion of the arc and median line of the Schiff at the $67 price level.

GDX offering a BUY ENTRYAMEX:GDX
All Suggestions Requests and Remarks are Welcome
Enthusiastically Brought to You by ManhattanStocks

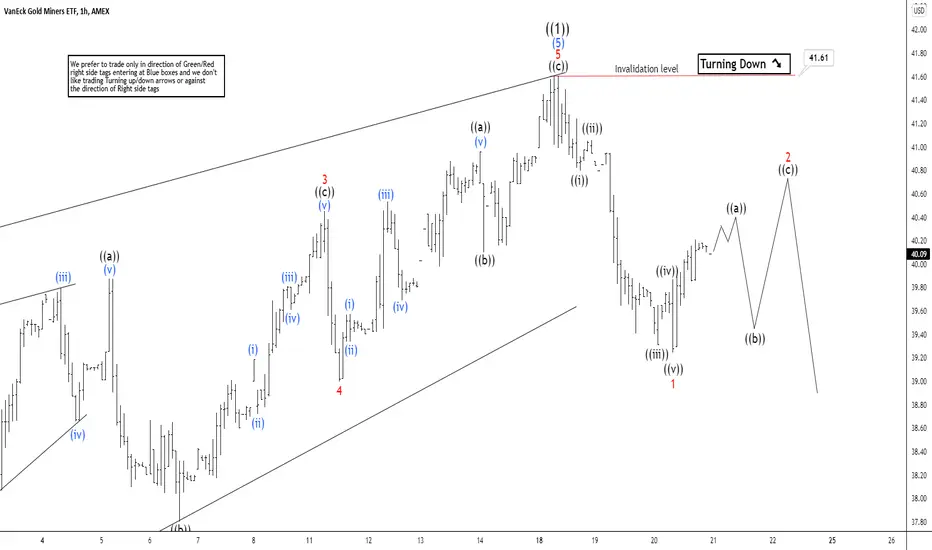
Elliott Wave View: GDX Pullback In ProgressShort term Elliott Wave view in GDX suggests cycle from October 2021 low ended in wave ((1)) at 41.61 as an impulse Elliott Wave structure. Pullback in wave ((2)) is currently in progress with internal subdivision as a zigzag (A)-(B)-(C). The ETF is currently within wave (A) of ((2)) with internal subdivision as a 5 waves. Down from wave ((1)), wave ((i)) ended at 40.8 and rally in wave ((ii)) ended at 41.06. The ETF then extends lower in wave ((iii)) towards 39.31, rally in wave ((iv)) ended at 39.87. Final leg lower wave ((v)) ended at 39.25 which completed wave 1 of (A) in higher degree.
Wave 2 bounce is now in progress to correct the decline from April 18 peak before the ETF resumes lower. Internal subdivision of wave 2 is unfolding as a zigzag structure where wave ((a)) of 2 is expected to end soon. GDX should then pullback in wave ((b)) before another leg higher to end wave ((c)) of 2. Afterwards, it should resume lower in wave 3 to continue the correction to the cycle from October 2021 low. Near term, as far as pivot at 41.61 high remains intact, expect rally to fail in the sequence of 3, 7, or 11 swing for further downside.
Try to run. Try to hide. Break on through to the other side.15-Year Resistance at play. GDX grinds through a battlefield of long term resistance in the $38 to $42 range. Once broken next big resistance @ $54.

GDX - Cup 'n Handle formationLarge-Cap gold miners change in price trend showed by Cup formation.
positive divergence in RSI and MACD (not included)
ROC above zero line, every other previous time this happened a bull run was fuelled.
Price above 200 Daily moving average

GDX continues rallyingTwo weeks ago, a break above 40 was expected , and it just closed the week above 40, in good fashion if I may say so.
The weekly GDX chart followed the previous week's long tailed doji and gapped up, ending near the week's high, with yet another lower tail. Bullish candlestick structure here. Technical RPM indicator is supportive of the momentum, although the MACD expects more.
The daily GDX chart is consistent with a continuing uptrend rally, with higher highs and higher lows. Technically supportive, both the RPM and MACD are crossed up and trending bullishly.
47.50 upside target in sight as projected previously.

4/10/22 GDXVanEck Gold Miners ETF ( AMEX:GDX )
Sector: Miscellaneous (Investment Trusts/Mutual Funds)
Market Capitalization: $ --
Current Price: $39.67
Breakout price: $39.80
Buy Zone (Top/Bottom Range): $38.70-$36.40
Price Target: $44.90-$45.80 (2nd)
Estimated Duration to Target: 100-107d (2nd)
Contract of Interest: $GDX 9/16/22 40c
Trade price as of publish date: $3.75/contract

$39 is a Historic level$39 on the GDX has been a big support/resistance level from the very beginning. In play once again.

Gold miners ETF (GDX) taking off again!The Gold Miners ETF, GDX, as expected, launched itself after a small recoil.
The Weekly chart key takeaway is that the MACD and RPM followed through, but better yet, this week saw the weekly candlestick to be in a rather bullish position, closing the week on a recent 9-month high.
Fibonacci projections bring a 47.50 upside target in the following weeks.
The Daily chart confirms the bullish indications similarly. Having bounced off an intermediate support, the technicals are turning bullish again as the strong close for the last day of the week encourages a breakout above 40.

Gold Keeps Shinning- nearly one-year consolidation base since May 2021
- initial breakout works well in February-March 2022
- consolidate between 36-40 in March after the breakout
- breaking out 40 could open up its next uptrend rally

GDX showing bearish signs! many rejections off this resistance zone, be careful if long! lower high after a double top.. very bearish signs IMO.
targeting 37.66-36.75-35.68

GDX 2hr - Zooming in on the daily lookDialing in to the 2hr chart, GDX continues to demonstrate a bullish stature... Looking for $52 - $54 range to cap off (5) of circle 3... with extension to 1.618 toward $59 as a possiblility. Metals can often extend in very bullish markets. GDX should remain above $35 near term, with $33.50 as my line in the sand.

GDX macro look... Would not short this...Gold charts are tricky right now, but examining the miners, we see a much larger bullish trend that portends higher.

GDX: Room for MoreFor GDX, there is still room for more upwards movement! As the ETF has only touched the blue zone between $39.30 and $43.86 so far, we expect it to go for it again and more firmly this time, crossing even the resistance at $40.13. After it has finished wave (b) in blue in the blue zone, GDX should rattle down through the support at $28.83 and into the magenta zone between $27.49 and $19.52, where it should complete wave (c) in blue as well as wave ii in magenta. Then, GDX should turn around and move upwards, heading for new highs above the resistance at $40.13. However, there is still a 30% chance that the price might not rise from the magenta zone but could fall through it and below the support at $16.18 instead.

GDX - Gold miners to outperformGDX relative to SPX looks like it is bottoming - note RSI divergence the last several months plus huge support at recent lows on relative chart going back a few years. It seems to me that GDX (gold miners) are probably going to significantly outperform the overall market in the months and quarters ahead. I am stepping into some selective longs looking for alpha.

GDX - Ready to Fly?Looks like GDX is ready to move up out of the channel depicted by the green line. Some work may need to be done in this area to get thru , but with the war, rising inflation and other macroeconomics factors it wouldn't take much to send this stock to new highs. Watching and waiting patiently for entry. NEM holds the key.
