GLD time to flee?18 days over the 5 day MA of lows in GLD. That ratio generally indicates a high. Let’s see if Powell adds fuel to the fire tomorrow.
GLD trade ideas

Long trade on GLD ETF buying the correctionAm less likely to look up a symbol of what am trading as not to build an emotional reaction to the trade. Am more concerned with the story the price chart tell me. Everything that everyone knows is reflected already on the price chart. Supply and Demand tell you a story. Learn to listen to it.
In this trade, we are looking at the most popular traded ETF for Gold. The setup is one of my best trade setups.
The long-term chart (M) is in uptrend. The current chart(W) is in a downtrend mostly a correction.
Price arrives in a Demand zone on the current-chart(W); providing a low risk entrance into the trade. the STP loss is below the Demand zone. and the trade is open. Blue arrow.
The stock market is bearish, the Gold react bullish. standard relationship as the big money withdrawal out of liquid stock into a temporarily safe haven of gold. History is predictable here.


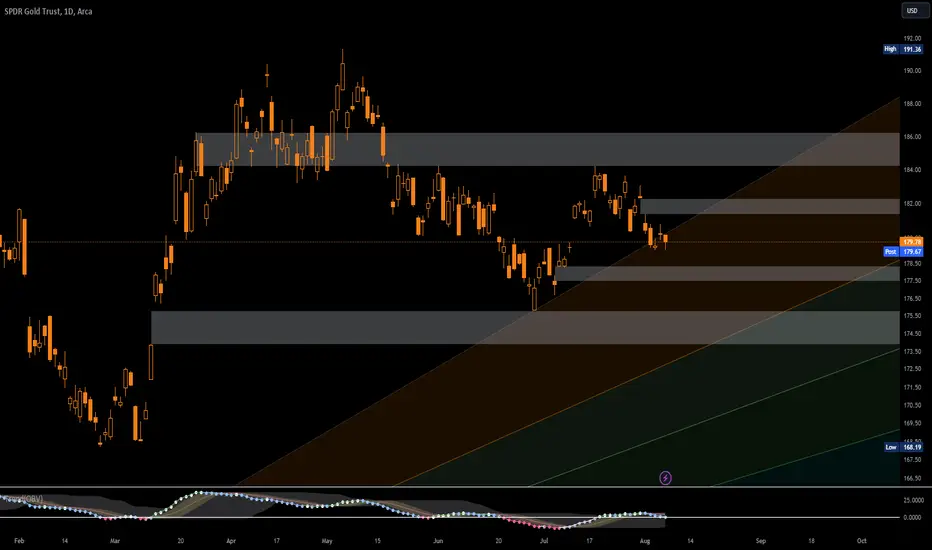
Puts idea - GoldI think is going to pull back to the 175 support before breaking out the channel. Just bought puts exp 10/20 strike 178. Is a little risky but I'm jumping in anyway.

$GLD lower after Friday's pop, return to 180 by Oct ExpirationGLD had a nice pop this week, but overall trend and positioning remains downside. Expecting a drift lower toward 175's put support before bouncing after 9/22 expiration toward 180+ into mid-October expiration. Follows the Gann Fan perfectly.

New bull market in Gold As per my Elliot Wave* analysis, Octobers low may mark the the mid-term bottom for gold and price has started to work on building the right hand side of the cup.
As long as 168 holds, I would expect the price to move towards next important resistance area 194-200 area. Ideally build a hand of the cup after reaching that level and break-out above 194 towards important next targets: 212-224-230.
Also notice the "Mona Lisa" of cup-and-handle pattern in GLD on a monthly time-scale
The symmetry and volume dynamics, that subsides in the handle area, is almost picture perfect.
Trading thesis : I will be looking for price to digest its rally from Oct lows, preferably around 177-180 area, creating a cheat pivot and relatively low risk entry point. This entry, if materializes, may create a good long-term opportunity to build position for the coming 2024 and potentially beyond.
* Important caveat to EW: I use it solely to have a subjective idea about sentiment and overall structural context to support, but not guide, my investing decisions. Price and volume is the key, and only price pays, not the fibonacci resistance or any wave count.

Short Gold UpdateLooks like the whole Russia situation will end up proping the ICEUS:DX1! , good for a small short entry. Whole week looked like a fakeout (Elon/Zuck won't happen anymore, they knew about sub hours into it happening etc) so I'll pay close attention in this area.

$GLD Gold Has a Double BottomIn technical analysis, a "Double Bottom" pattern is a bullish reversal pattern that typically signifies a potential change in trend from downward to upward. In the context of AMEX:GLD (Gold), spotting a Double Bottom pattern suggests that the asset has tested a support level twice and rebounded, indicating strong buying interest at that price level. This can be interpreted as a sign that the downward momentum is waning, and a bullish reversal is likely on the horizon.
Investors observing a Double Bottom in AMEX:GLD would be watching closely for a breakout above the resistance level that tops the pattern, often accompanied by increased volume, as a confirmation that the asset could be entering a new bullish phase. However, as always, it's crucial to use other forms of analysis and indicators to validate any trading decisions.

Gold if I may be so bold Well 8 days under the 2 day MA of highs. That’s usually about it around a 4 to 1 ratio. Let’s see if we get a reversal tomorrow or Friday and how serious it is.

Head and Shoulders pattern on SPD Gold Trust Sell for 166Head and shoulders formed on D1 chart.
On
i saw that pattern formed too.
So i suggest short sell for GLD for 1:1 target from head to shoulders ( to ~ 166$).
Good luck!

Time to DCA into some more GLDI am bullish on TVC:GOLD long term, so scooping up some more at these prices

GLD Double Bull Flag From 2 Perspectives, could this be it?@Tradersweekly @tradersweeklysignal check out this perspective on gold when you zoom out. Your case was bearish short term but on these two longer time frames it looks really bullish, don't you think?
Let me know if my bull flags are inaccurate.
Thanks
Kyle

GLD - Hold?About 89 days under the 89 day MA of highs. Truly a perfect consolidation example. Could be a significant rally if it breaks through higher. If very long multi year top holds it could really crater.

$GLD: Bulls at 180 may keep it goingSaw a big move through GLD 180 and GDX 30 today, with metals like steel ( AMEX:SLX ) potentially not far behind. Some of this correlates to persistent inflation in the market so heads up. Recently we posted about the possibility of NYSE:CF continuing through the 85 handle. If AMEX:XLB can get a bounce of 80 all the better. Good luck traders!

GLD - all time highs?Well GLD sits around 179 and my entry band is around 181. Let’s see if we get real headway this time up.

Expired GLD Weekly outlook. 3rd WK SEP 2023Expired GLD Weekly outlook. 3rd WK SEP 2023
> NEUTRAL 📊 CORRECT
Closed Price: 178.34
Target Price: 178.42 | Strike Price: 179.38 SEP18
Upper Range: 183.84
Lower Range: 172.99

Expired GLD Weekly outlook. 2nd WK SEP 2023Expired GLD Weekly outlook. 2nd WK SEP 2023
> NEUTRAL 📊 CORRECT
Closed Price: 178.08
Target Price: 178.48 | Strike Price: 178.59 SEP11
Upper Range: 183.91
Lower Range: 173.05

GLD Garbage Lousy Drek?Well it looks like GLD is going to reverse. Let’s see how severe and protracted it is.

Short setup at $179 on GLDMy attention has been brought the past couple days to gold. It still hasn't reached my lower targets and we're getting much closer to September where I think the guidance is suggesting a longer term low. I'm still learning though as all my ideas come from my work dowsing.
I do, however, like that it's been trending down into that date. There is a suggestion of some serious selling coming, so I want to journal this one. I'll look to get in short around $179 today, assuming it reaches it and my readings still suggest a reversal down.
I will give it 3 weeks, but don't think it's going to take that long to hit my lower target. That's it.

GLD - is that it?Very very rarely will I preemptively get into a position before price breaks an MA of merit. This is one of those times. With GLD under the containment MA of 2 days of highs for 8 days, the containment ratio of 4+ is very rare and I would argue a case where one might get preemptively long. Let’s see what happens the rest of the week maybe into next. Catching the falling knife is rarely wise but this is the one case where perhaps the knife has already hit the ground.

Levels to trade GLDContrary to popular belief, gold is a risk asset, and as such, cannot serve as a reliable store of value. It also doesn’t offer better protection from inflation than equities. That is true for the long term; however, in shorter periods, the yellow metal can be a profitable trade, specifically at times of declining real interest rates and when the economy is weak. Besides, gold, with its zero-to-negative correlation to equities, can help achieve a broad portfolio diversification, which is important, as each asset class can help mitigate different risks in times of increased economic, political, and market uncertainty.
SPDR GOLD can show you Path of GOLDThe price is at the beginning of wave 5 of wave B. After the end of this wave, the corrective wave C will begin.
It is very likely that after the correction, we will see a strong upward movement.

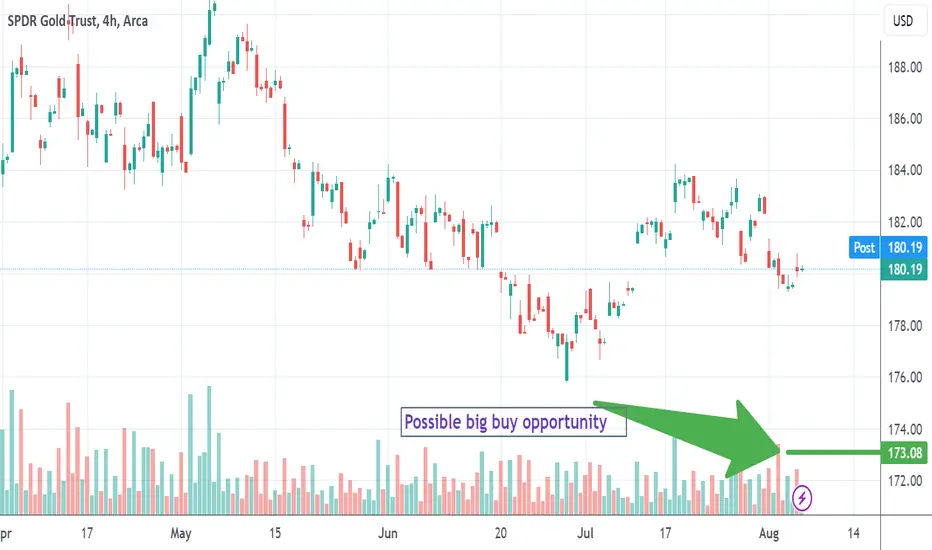
Something to watch in GLDThis is really early, but I know people like to check on gold and it's been fairly choppy and dull.
I attempted an outlook for the year kind of reading on it in April with dates for lows and highs, etc. The results of the dates were off a day or 2 usually, and weren't necessarily reflective of the bigger swings. I will keep playing with this idea though.
So, I checked in for an update, and there is something consistent from that reading to today's, and that is that there is a buying opportunity in September. And I also get a consistent low number to watch for, and that is the price of $173-74. (4% from here).
There can by some seasonality in the 4th quarter in gold, so this lines up as well.
The specific date (plus or minus a couple days) is Sept. 12th. The reading in April was referencing September as the "best buying opportunity", so at least that is consistent.
I will set alerts at $175 to keep an eye on things, and may post this idea again closer to the date. In the mean time I suppose you could try to short it because the advice is for multiple days down.