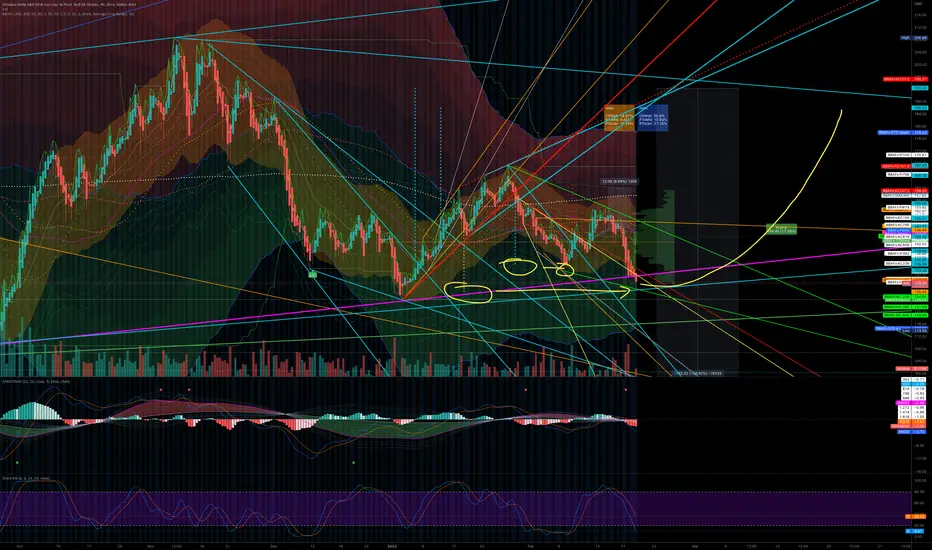
GUSH in Buy ZoneMy trading plan is very simple.
I buy or sell when at three of these events happen:
* Price tags the top or bottom of parallel channel zones
* Money flow spikes beyond it's Bollinger Bands
* Stochastic Momentum Index (SMI) at near oversold overbought level
* Price at Fibonacci levels
So...
Here's
Key stats
About Direxion Daily S&P Oil & Gas Exp. & Prod. Bull 2X Shares
Home page
Inception date
May 28, 2015
Structure
Open-Ended Fund
Replication method
Synthetic
Dividend treatment
Distributes
Distribution tax treatment
Ordinary income
Income tax type
Capital Gains
Max ST capital gains rate
39.60%
Max LT capital gains rate
20.00%
Primary advisor
Rafferty Asset Management LLC
Distributor
Foreside Fund Services LLC
GUSH seeks to deliver 200% of the daily performance of the S&P Oil & Gas Exploration & Production Select Industry Index. Unlike State Streets XOPan unlevered fund tracking the same indexGUSH uses over-the-counter derivatives to achieve its objective. As with all levered and inverse funds, GUSH should not be expected to deliver 2 times the performance of its index for periods longer than one day. Compounding and path-dependency can cause significant deviations over longer time frames, so it's best used for single-day tactical plays. It's worth noting that GUSH's index is equal weighted, market-cap weighting would require extreme concentration in a handful of major firms. As a result, GUSH exhibits a serious small-cap tilt and the elevated market risk that comes with it. GUSH's leverage factor only amplifies the potential for volatility. Trading costs should be taken into consideration. Prior to March 31, 2020, the fund provided 300% daily performance return of the same index.
Related funds
Classification
What's in the fund
Exposure type
Energy Minerals
Cash
Stock breakdown by region
Top 10 holdings

XOP To The Moon?As we have seen, XOP has struggled to maintain itself even with all of the middle east tensions going on. I still believe we will see a higher high soon enough. Patience is key. I am going to let the chart do its thing.

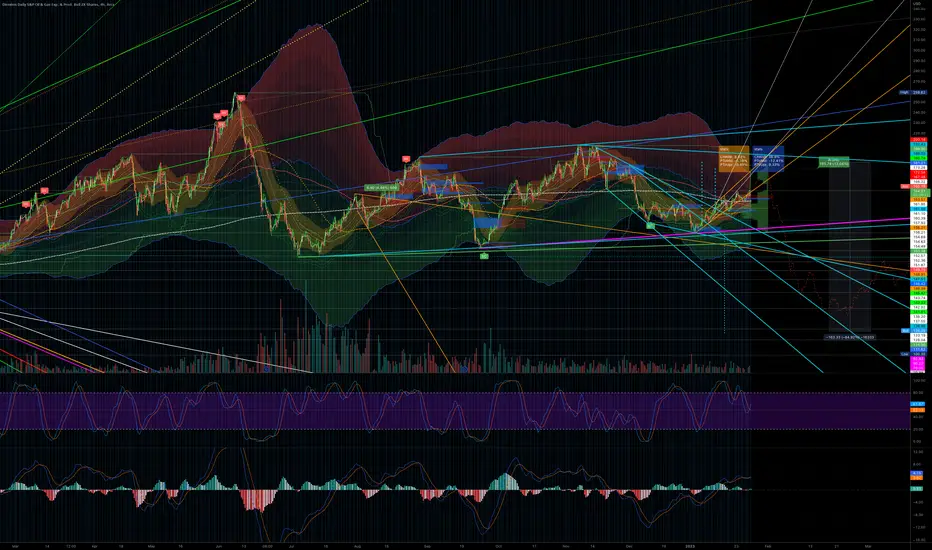
GUSH from $27.62 to $31MODs have suggested that I provide more detail about the picks I make.
Sorry. I'm not as verbose as y'all, and I don't like things to be complicated.
My trading plan is very simple.
I buy or sell at top & bottom of parallel channels.
I confirm when price hits Fibonacci levels.
Bonus if a TTM Sq

Gush BULLISH on all higher time framesUsing some fib levels we notice that after this longe triangle breakout that gush retested the 50% fib line from the first pump. This is a solid sign that the oil and gas market is about to go up significantly. Drip just broke a parallel channel and is looking to hit the bottom of that downward wedg


GAS started a jump; would OIL do the same?Last two weeks we saw a jump in the natural gas stocks and ETFs and the oil based stocks were ranging or had a jump (like BP).
This looks like a break out.
Never forget to put SL

5 hearts, is not enough? Y will update my play here, because this is huge now, like 50% exiting the bullish flag.

2 of 3 targetsToday we reached 2 of my 3 targets, lets see how china affects the OIL demand and other products from the refineries.
i like this for a sabe 13%, but...There is a huge bear flag after the end of the trend. i like more $DRIP for a 80%
GUSH Daily Perspective Fib & TrendlinesWe seem to have a double top forming at the 0.786 retracement level on this bearish Fibonacci. Will GUSH continue to lag behind USOIL and drive up one last time to fill the gap at $225.00 on a daily wick before moving downwards and catching up with USOIL?

See all ideas
Summarizing what the indicators are suggesting.
Oscillators
Neutral
SellBuy
Strong sellStrong buy
Strong sellSellNeutralBuyStrong buy
Oscillators
Neutral
SellBuy
Strong sellStrong buy
Strong sellSellNeutralBuyStrong buy
Summary
Neutral
SellBuy
Strong sellStrong buy
Strong sellSellNeutralBuyStrong buy
Summary
Neutral
SellBuy
Strong sellStrong buy
Strong sellSellNeutralBuyStrong buy
Summary
Neutral
SellBuy
Strong sellStrong buy
Strong sellSellNeutralBuyStrong buy
Moving Averages
Neutral
SellBuy
Strong sellStrong buy
Strong sellSellNeutralBuyStrong buy
Moving Averages
Neutral
SellBuy
Strong sellStrong buy
Strong sellSellNeutralBuyStrong buy
Displays a symbol's price movements over previous years to identify recurring trends.
Frequently Asked Questions
An exchange-traded fund (ETF) is a collection of assets (stocks, bonds, commodities, etc.) that track an underlying index and can be bought on an exchange like individual stocks.
GUSH trades at 21.73 USD today, its price has fallen −7.10% in the past 24 hours. Track more dynamics on GUSH price chart.
GUSH net asset value is 21.73 today — it's fallen 6.01% over the past month. NAV represents the total value of the fund's assets less liabilities and serves as a gauge of the fund's performance.
GUSH assets under management is 242.29 M USD. AUM is an important metric as it reflects the fund's size and can serve as a gauge of how successful the fund is in attracting investors, which, in its turn, can influence decision-making.
GUSH price has fallen by −7.92% over the last month, and its yearly performance shows a −39.23% decrease. See more dynamics on GUSH price chart.
NAV returns, another gauge of an ETF dynamics, have fallen by −6.01% over the last month, showed a 12.91% increase in three-month performance and has decreased by −37.59% in a year.
NAV returns, another gauge of an ETF dynamics, have fallen by −6.01% over the last month, showed a 12.91% increase in three-month performance and has decreased by −37.59% in a year.
GUSH fund flows account for −51.95 M USD (1 year). Many traders use this metric to get insight into investors' sentiment and evaluate whether it's time to buy or sell the fund.
Since ETFs work like an individual stock, they can be bought and sold on exchanges (e.g. NASDAQ, NYSE, EURONEXT). As it happens with stocks, you need to select a brokerage to access trading. Explore our list of available brokers to find the one to help execute your strategies. Don't forget to do your research before getting to trading. Explore ETFs metrics in our ETF screener to find a reliable opportunity.
GUSH invests in stocks. See more details in our Analysis section.
GUSH expense ratio is 0.93%. It's an important metric for helping traders understand the fund's operating costs relative to assets and how expensive it would be to hold the fund.
Yes, GUSH is a leveraged ETF, meaning it uses borrowings or financial derivatives to magnify the performance of the underlying assets or index it follows.
In some ways, ETFs are safe investments, but in a broader sense, they're not safer than any other asset, so it's crucial to analyze a fund before investing. But if your research gives a vague answer, you can always refer to technical analysis.
Today, GUSH technical analysis shows the strong sell rating and its 1-week rating is sell. Since market conditions are prone to changes, it's worth looking a bit further into the future — according to the 1-month rating GUSH shows the sell signal. See more of GUSH technicals for a more comprehensive analysis.
Today, GUSH technical analysis shows the strong sell rating and its 1-week rating is sell. Since market conditions are prone to changes, it's worth looking a bit further into the future — according to the 1-month rating GUSH shows the sell signal. See more of GUSH technicals for a more comprehensive analysis.
Yes, GUSH pays dividends to its holders with the dividend yield of 3.18%.
GUSH trades at a premium (0.01%).
Premium/discount to NAV expresses the difference between the ETF’s price and its NAV value. A positive percentage indicates a premium, meaning the ETF trades at a higher price than the calculated NAV. Conversely, a negative percentage indicates a discount, suggesting the ETF trades at a lower price than NAV.
Premium/discount to NAV expresses the difference between the ETF’s price and its NAV value. A positive percentage indicates a premium, meaning the ETF trades at a higher price than the calculated NAV. Conversely, a negative percentage indicates a discount, suggesting the ETF trades at a lower price than NAV.
GUSH shares are issued by Rafferty Asset Management LLC
GUSH follows the S&P Oil & Gas Exploration & Production Select Industry. ETFs usually track some benchmark seeking to replicate its performance and guide asset selection and objectives.
The fund started trading on May 28, 2015.
The fund's management style is passive, meaning it's aiming to replicate the performance of the underlying index by holding assets in the same proportions as the index. The goal is to match the index's returns.