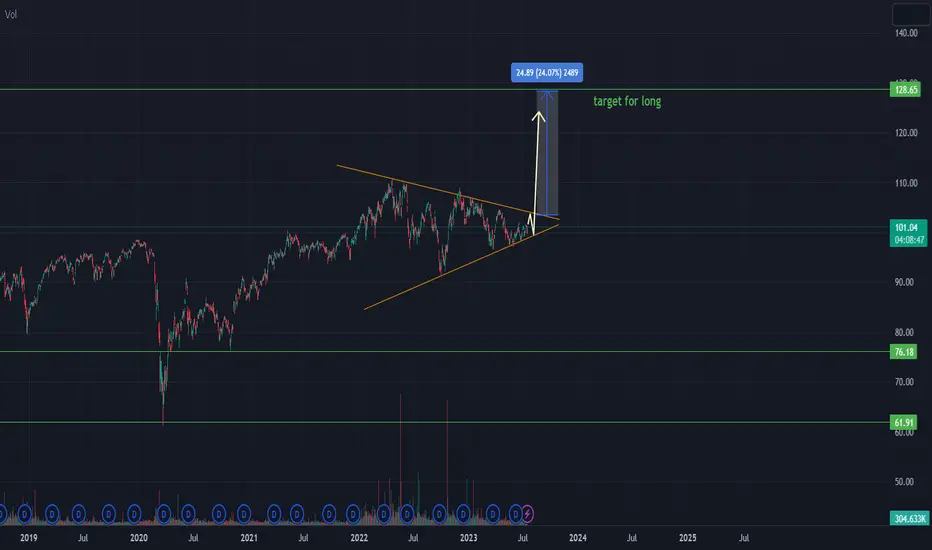
HDV long positionOn the chart we can see a bullish pennant formation. We expect the price will increase soon.
Our strategy is entering long position once the price breaks upper the resistance line.
Target for long is shown on the chart.
Key stats
About iShares Core High Dividend ETF
Home page
Inception date
Mar 29, 2011
Structure
Open-Ended Fund
Replication method
Physical
Dividend treatment
Distributes
Distribution tax treatment
Qualified dividends
Income tax type
Capital Gains
Max ST capital gains rate
39.60%
Max LT capital gains rate
20.00%
Primary advisor
BlackRock Fund Advisors
Distributor
BlackRock Investments LLC
HDV offers complex high-dividend yield exposure in an ETF wrapper. Eligible securities must pass two Morningstar proprietary screens, each designed to ensure sustainability. The first is the presence of an economic moat something that sets the firm apart from its peers. This helps the fund weather downturns. (The MOAT ETF uses this approach without the high-dividend yield focus.) The second is a forward-looking comparison of assets to liabilities. REITs are excluded. HDV targets 75 stocks by dividend yield. Stocks are weighted by the total dollar amount of dividends paid rather than yield. It is perhaps this last step that gives the fund it bias towards larger firms, while the sum total of all the steps produces unique sector biases. In all, HDV delivers a high-yield play with robust sustainability screens. The index undergoes quarterly rebalance and reconstitution.
Related funds
Classification
What's in the fund
Exposure type
Health Technology
Consumer Non-Durables
Energy Minerals
Stock breakdown by region
Top 10 holdings
Looking back at Equity Factors in Q2 with WisdomTreeMarkets in Q2 2022 continued to suffer from entrenched inflation and aggressive rate hikes from central banks. They also reacted to the slowdown of the global economy and the increased risk of a recession in developed economies. These changing market conditions impacted equity factors differently.

Defensives vs SPY 2022XLU, HDV and SPY performance for 2022. Defensive plays outperformed SPY so far.

$HDV 2021-JUN-22$HDV has broken below the rising trend, however has bounced above the cut line. Worth watching.

See all ideas
Summarizing what the indicators are suggesting.
Oscillators
Neutral
SellBuy
Strong sellStrong buy
Strong sellSellNeutralBuyStrong buy
Oscillators
Neutral
SellBuy
Strong sellStrong buy
Strong sellSellNeutralBuyStrong buy
Summary
Neutral
SellBuy
Strong sellStrong buy
Strong sellSellNeutralBuyStrong buy
Summary
Neutral
SellBuy
Strong sellStrong buy
Strong sellSellNeutralBuyStrong buy
Summary
Neutral
SellBuy
Strong sellStrong buy
Strong sellSellNeutralBuyStrong buy
Moving Averages
Neutral
SellBuy
Strong sellStrong buy
Strong sellSellNeutralBuyStrong buy
Moving Averages
Neutral
SellBuy
Strong sellStrong buy
Strong sellSellNeutralBuyStrong buy
Displays a symbol's price movements over previous years to identify recurring trends.
Frequently Asked Questions
An exchange-traded fund (ETF) is a collection of assets (stocks, bonds, commodities, etc.) that track an underlying index and can be bought on an exchange like individual stocks.
HDV trades at 118.30 USD today, its price has risen 0.02% in the past 24 hours. Track more dynamics on HDV price chart.
HDV net asset value is 118.34 today — it's fallen 0.14% over the past month. NAV represents the total value of the fund's assets less liabilities and serves as a gauge of the fund's performance.
HDV assets under management is 11.07 B USD. AUM is an important metric as it reflects the fund's size and can serve as a gauge of how successful the fund is in attracting investors, which, in its turn, can influence decision-making.
HDV price has fallen by −0.29% over the last month, and its yearly performance shows a 2.85% increase. See more dynamics on HDV price chart.
NAV returns, another gauge of an ETF dynamics, have risen by −0.14% over the last month, have fallen by −0.14% over the last month, showed a 3.15% increase in three-month performance and has increased by 6.74% in a year.
NAV returns, another gauge of an ETF dynamics, have risen by −0.14% over the last month, have fallen by −0.14% over the last month, showed a 3.15% increase in three-month performance and has increased by 6.74% in a year.
HDV fund flows account for −19.09 M USD (1 year). Many traders use this metric to get insight into investors' sentiment and evaluate whether it's time to buy or sell the fund.
Since ETFs work like an individual stock, they can be bought and sold on exchanges (e.g. NASDAQ, NYSE, EURONEXT). As it happens with stocks, you need to select a brokerage to access trading. Explore our list of available brokers to find the one to help execute your strategies. Don't forget to do your research before getting to trading. Explore ETFs metrics in our ETF screener to find a reliable opportunity.
HDV invests in stocks. See more details in our Analysis section.
HDV expense ratio is 0.08%. It's an important metric for helping traders understand the fund's operating costs relative to assets and how expensive it would be to hold the fund.
No, HDV isn't leveraged, meaning it doesn't use borrowings or financial derivatives to magnify the performance of the underlying assets or index it follows.
In some ways, ETFs are safe investments, but in a broader sense, they're not safer than any other asset, so it's crucial to analyze a fund before investing. But if your research gives a vague answer, you can always refer to technical analysis.
Today, HDV technical analysis shows the neutral rating and its 1-week rating is buy. Since market conditions are prone to changes, it's worth looking a bit further into the future — according to the 1-month rating HDV shows the buy signal. See more of HDV technicals for a more comprehensive analysis.
Today, HDV technical analysis shows the neutral rating and its 1-week rating is buy. Since market conditions are prone to changes, it's worth looking a bit further into the future — according to the 1-month rating HDV shows the buy signal. See more of HDV technicals for a more comprehensive analysis.
Yes, HDV pays dividends to its holders with the dividend yield of 3.43%.
HDV trades at a premium (0.04%).
Premium/discount to NAV expresses the difference between the ETF’s price and its NAV value. A positive percentage indicates a premium, meaning the ETF trades at a higher price than the calculated NAV. Conversely, a negative percentage indicates a discount, suggesting the ETF trades at a lower price than NAV.
Premium/discount to NAV expresses the difference between the ETF’s price and its NAV value. A positive percentage indicates a premium, meaning the ETF trades at a higher price than the calculated NAV. Conversely, a negative percentage indicates a discount, suggesting the ETF trades at a lower price than NAV.
HDV shares are issued by BlackRock, Inc.
HDV follows the Morningstar Dividend Yield Focus Index. ETFs usually track some benchmark seeking to replicate its performance and guide asset selection and objectives.
The fund started trading on Mar 29, 2011.
The fund's management style is passive, meaning it's aiming to replicate the performance of the underlying index by holding assets in the same proportions as the index. The goal is to match the index's returns.