HYG - long US high yield bonds - after correctionI still reckon there is some decent upside in equities going forward but also think we may need a bit of a shakeout first.
HYG trade ideas


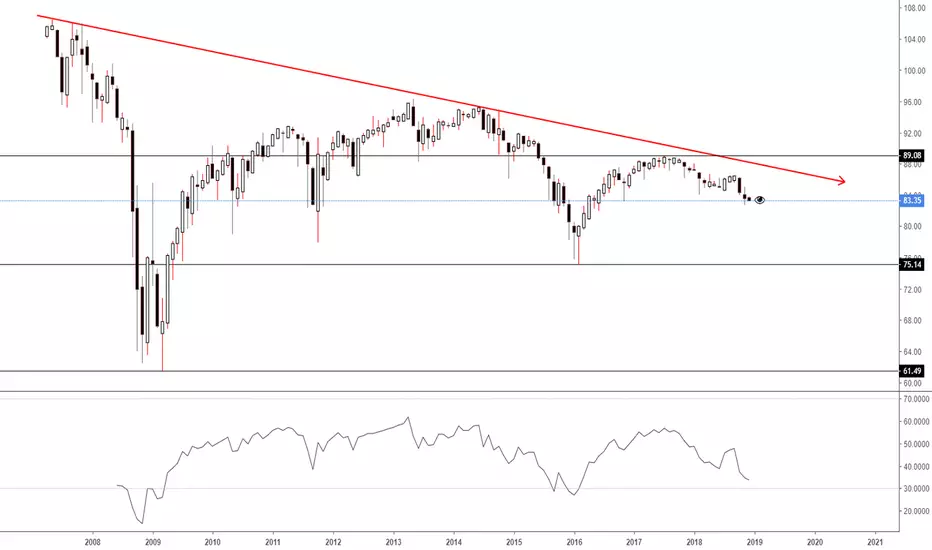
Outlook to 8 months lowOverview of HYG pointing to test 8 months low which you could find a gap around 82 to 83 in a weekly timeframe.

HYG might be time to shortHYG is hitting downward trend line resistance in a wedge pattern. It might be a good time to short. If the economy starts to break out inflation expectations should rise and all rates including high yield should rise. If the economy begins to tank, High yield bonds will be suspect and yields for junk bonds should rise as the likelihood of bankruptcy increases. If yields rise price goes down. Essentially shorting HYG is a long straddle

Short the $HYG Rejected Top of Previous Support Now (Resistance)Rejected past support now serving as new resistance level two days ago. See below. Do not trade based on my opinion. I am short HYG with puts.

High Yield Bonds (Junk Bonds) Hitting Monthly Trendline
High yield bonds (junk bonds) hit monthly resistance line.
Fundamentally, the US corporate debt has almost doubled since 2008.
Right now over 50% of them in the market are BBB, which is just a cut above junk.
Further analysis: youtu.be/V7zEXiqiiqA

Trade of the decade - short the bubble $HYG $IGEvening traders,
This is a difficult one, but one that will be immensely profitable for anyone that gets the timing right.
This thing is going to blowup. Could be tomorrow, could be a couple years. This one will be a historic trade, might not even be a bad idea to scoop some 2021 OTM puts on the low.
It's hard to bet against a sitting president, so timing will ultimately be the trade, because there is nowhere for this to go but down.
Let me know your opinions in the comment section below, and as always smash that like and follow button!

Short HYG for a Cheap Short in this Environment AMEX:HYG
If HYG breaks $85 I'm continuing short. Disclaimer: Trade at your own risk.

Confluence of coincidence: $HYGLast Oct I published a series of charts named “The preponderance of evidence”, I think it is time for a new series. I think the charts itself should be self explanatory. Feel free to drop me a line on what you think.

HYG stock price forecast timing analysis. 13-JunStock investing strategies by pretiming
Investing position about Supply-Demand(S&D) strength: Rising section of high profit & low risk
Supply-Demand(S&D) strength linkage Trend Analysis: In the midst of an adjustment trend of downward direction box pattern stock price flow marked by limited rises and downward fluctuations.
Today's Supply-Demand(S&D) strength Flow: Supply-Demand strength has changed to a strengthening buying flow when stock market opening.
Possibility of change in forecast timing: Forecast timing has become high variability conditions. because the flow of supply - demand has changed, and the supply - demand linkage is unstable.
D+1 Candlestick Color forecast: GREEN Candlestick
%D+1 Range forecast: 0.1% (HIGH) ~ 0.0% (LOW), 0.1% (CLOSE)
%AVG in case of rising: 0.3% (HIGH) ~ -0.1%(LOW), 0.3% (CLOSE)
%AVG in case of falling: 0.1% (HIGH) ~ -0.2%(LOW), -0.1%(CLOSE)
Stock Price Forecast Timing Criteria: Stock price forecast timing is analyzed based on pretiming algorithm of Supply-Demand(S&D) strength.
Read more a detailed Forecast Analysis Reports that candlestick shape and %change, S&D strength flow in the future 7 days.
www.pretiming.com


What usually comes from retests?Altough most of the proes out there are used to wait a retest before entering a long position (I love retests too in specific markets, and when certain criteria are matched), I can tell you that TECHNICALLY retest are the worst thing that can happen during a breakout. It weakens momentum and confidence in speculator. You get closer to where most of the stops are set. It could escalate in a long sqeeze quickly.
Not meaning I'm not short here. Good luck all

Chart of the Day: $HYG under pressure$85.50 is the key neckline support for $HYG as it bounces off the top boundary of wedge pattern. The neckline can be seen with multiple previous SSR levels. The downward bias is reinforced by the current SSR level for which price action is firmly pinned under.
With an earnings recession in progress and oil demand in question, it is inevitable to see some stress emerging in the junk bond segment which has a fairly high representation of US shale players.

BKLN vs. HYG | Leveraged Loans Underperforming High YieldEarlier this year I pointed out how leveraged loans are increasingly in a precarious position as underlying economic fundamentals deteriorate around the world. Another way of measuring the risk premium is to observe the performance spread between the leverage loan bonds (orange line) and high yield bonds (candles). Both are in logarithmic scale.


High yield corp. bondsbig wedge forming over last two decades. no where near ATH's, unless MMT works. $SPY

HYG - looking for cluesUS equities have been heading up in more or less a straight line since Christmas. This count is looking for clues as to where the market might draw a breath. Reckon there might be more upside before we see any serious correction though. Probably a lot higher than I suggest here too.


TROUBLE AHEAD IN BONDS AND RISK TRADE Well we finally reached the peak in HYG at .786 and the NYSE TARGET OF 13010 PLUS OR MINUS 10 .I am bearish and look for a decline phase now there is a focus date may 6 to 12 oil has peaked as well but under the wave structure we could still see alt at 65.66 but would not trade it I


When resistance becomes support.Is this the case? Maybe too shy to be cosidered relevant, it is still something though.
