$HYG - High Yield Bonds Sending a Sign?As can be seen on its weekly chart, the $HYG appears to be sending a warning signal. On a technical basis, a "Shooting Star" pattern has emerged, coupled with negative divergence in the SMI and RSI indicators.
To us, it appears that high yield bonds are sending a signal that its rallying may be getting a little stretched.
We would caution investors to tread carefully and take some money off the table if in this space.
HYG trade ideas


HYG CORP DEBT COMING TO A CROSSROAD FOR US MARKETS SINCE PEAK IN CORP DEBT HYG AFTER THE 5 WAVE DOWN TO PANIC LOW 2009 WE HAVE BEEN WITHIN A LARGE TRIANGLE ONE WAVE COUNT RAISES A FLAG ANOTHER SEE US GOING TO 90.50 AND ONE PEAKS NEAR 88.50 ARE WE READY TO BREAK AWAY FROM THE PAST OR ARE WE BOUND TO IT . I AM NOT SURE . BEST OF TRADES !!!!


fomc long box (risk defined)this is a ghetto nobs trade for a retail investor using bond etfs. its a way of taking advantage of current tightness in bond spreads but likelyhood for expansion of spreads post fomc. in this scenario we'll use hyg (corporate credit) as a proxy for short term notes and tlt as a proxy for long term bonds they have a very nice inverse correlation to one another. so if a participant were expecting tightness in credit markets on a retail basis one could
short corporate credit and go long on longer term bonds. on this play im anticipating a dovish message from the fomc
the international community has favored this stance through their own easing plans.
hyg 50 delta bull call. 100 wide (in out). $.40
tlt bear put .50 delta 100 wide (in out). $.34
both are Low IV plays so the cost basis will be miniscule but the potential payout is pretty sweet with minimal risk (debit paid)

TRADE IDEA (IRA): HYG SEPT 20TH 82 SHORT PUTMetrics:
Max Profit: $173/contract
Buying Power Effect (Cash Secured): $8026
Break Even: 80.26/share
Delta: 31.71
Theta: .67
Notes/Comments: Up to this point, I haven't posted many of my IRA trade ideas, primarily because they are way longer-dated setups than people are generally interested in, and I've also been an infrequent buyer of the underlyings that make up my portfolio -- a fairly mundane mix primarily made up of SPY, EFA, TLT, and IYR covered calls where setup management consists of looking at the short calls from time to time and rolling them out for duration, credit, and further cost basis reduction. It isn't very exciting, and I may not have to do much for weeks, if not months, in certain cases.
Naturally, this trade is not going to be attractive to everyone; you are, after all, going to be tying up $8k of buying power for a very long time with a return on capital of about 2.16% if you do nothing and the short put expires worthless. For me personally, I have idle cash sitting in the IRA earning virtually nothing, and I don't anticipate adding to my core positions in short order given my cost basis, where these underlyings are in the grand arc of time, and my proximity to retirement. Moreover, one of my basic IRA rules is not to undertake single name risk, so my basic options are (a) do nothing; or (b) stick something out there and get paid to wait for the price at which I want to acquire.
Here, I'm interested in acquiring HYG with its attractive 5.46% yield, but at a price discounted substantially over where it's currently trading; otherwise, I simply don't want the shares. I can either wait until price gets there or sell puts that will result in a cost basis at or below what I'd like to get in at if I'm assigned. Here, I'm opting for the latter ... .
Post fill, I'll periodically look to roll for duration and credit to reduce cost basis further.

In FED we trust ... Amen.Credit markets have gone crazy... history repeats itself. Look at this insane surge for the junk bond market.

Head n Shoulder - High Yield Junk Bonds!! SHORTLong Term setup here - you know what to do.
Targets Marked on chart.

WORLD BOND AND STOCK MARKET AT CROSSROAD AND TOP X WAVE OR 1 TREND CHANGE WITHIN 1 TO 3 DAYS FIB TURN IN HYG HOW DEEP TELL US THE NEXT 12 MONTHS'

The Playground in the High Yield Market is NarrowingCan central bank liquidity provision (or the talk there of) be enough to provide an incentive to reach for yield, or will credit spreads begin to widen (again). Stay tuned. From the this chart above it appears we are winding into a decision point.

HYG RangeWould look to short at $88 and cover at two levels $80 and then $70. Fundamentals are looking very weak for High Yield Bonds with rising interest rates; having held up strongly over the recent selloff in equities.

HYG- Attempt a short in or above the value zonePersonal Reference.
Expect a small climb or some consolidation to allow for the oscillators to reach close to overbought and/or recoil on the down trend line.
Look to short in or above the value zone- reviewing the oscillators.
Stop Loss 1.5 ATR Channel


HYG Missed opportunityHilarious drop and bounce back for corporate bonds. Missed out on that one, HYG has low options premiums. Also, note how it drops after rate hikes are announced, no anticipation at all so there's an opportunity there in the future as well.
If any of my followers are bond experts, feel free to chime in. Thanks.


Corporate Bonds Flash Signs of Collapse! (HYG)Hi friends! Welcome to this never-before-seen analysis, on the High Yield Corporate Bond market, via the weekly chart for the HYG ETF! Let's get right to it!
Looking at the high yield corporate bond market, we can immediately see that the technical picture is quite grim. We have a very clear, massive head and shoulders pattern that is currently developing. Specifically, price is in the process of completing the right shoulder. Keep in mind, that this is a weekly chart, so each candlestick on the chart contains an entire week of trading. As you can see on the chart, the past few months have been practically straight down.
In case you aren't sure about what high yield corporate bonds are, they can be described as a type of corporate bond that offers a higher rate of interest because of its higher risk of default. When companies with a greater estimated default risk issue bonds, they may be unable to obtain an investment-grade bond credit rating. As a result, they typically issue bonds with higher interest rates in order to entice investors and compensate them for this higher risk.
High-yield bond issuers may be companies characterized as "highly leveraged" or those experiencing financial difficulties. Smaller or emerging companies may also have to issue high-yield bonds to offset unproven operating histories or because their financial plans may be considered speculative or risky. That is how the SEC defines high yield corporate bonds.
With that said, it's no secret that Corporate America is heavily leveraged to debt. As I've reported before, they are depending on EPS growth and increased stock prices, to sustain themselves during this period of historic debt leveraging. Corporate America is engaging in high risk activity, and they will be completely destroyed if the stock market collapses.
According to the SEC's definition of economic risks, in relation to the high yield corporate bond market, they warn that "if the economy falters, some investors are likely to try to sell their bonds. In what is known as a “flight to quality,” a number of investors may decide to replace their riskier high-yield bonds with safer ones, such as US Treasury bonds. In addition, some companies that issue high-yield bonds may be less able to weather challenging economic circumstances, increasing the risk of default."
In response to the "flight to quality" scenario, I would argue that US Treasury bonds aren't "high quality" at all. Sure, they may currently be rated as AAA, but there is a very clear debt bubble, a bubble in the bond market, and the potential for foreign nations like China, to sell trillions of dollars of US Treasuries into the market, which would collapse the bond market and cause interest rates to skyrocket.
Regardless, it's clear that the high yield corporate bond market is under major pressure. The reason is because the stock market is beginning to implode, and the holders of these high risk GARBAGE corporate bonds, are starting to run for the hills. This chart is showing us that the stock market is likely to continue to fall. It's showing us that declining equity prices are likely going to PUNISH companies who are over leveraged to debt. That's why I've said in recent analyses that we could see rolling corporate bankruptcies in the US, as companies default to the debt that they are so heavily levered against.
On the chart, price is clearly forming a head and shoulders pattern. Price is also in a massive downtrend channel (in blue) that extends as far back as 2007. To reach the bottom of the channel, bond prices could fall 45% from current levels, and it could get much worse than that. Sell side volume is exploding on the chart. I don't want to spread panic, but this is a very serious issue that could easily cause a domino effect of debt defaults worldwide. That's why I believe we could even witness a currency crisis, if things get bad enough.
Happy New Year Everyone!
I'm the master of the charts, the professor, the legend, the king, and I go by the name of Magic! Au revoir.
***This information is not a recommendation to buy or sell. It is to be used for educational purposes only.***
-JD-

Junk Bonds - Deteriorating Technicals - #Stocks #Bonds #MarketsLooks like weakness is beginning to show up in junk bonds, which in turn, does not bode well for stocks or other risky assets.
It looks like the recent selloff is not just due to market overreaction, but more due to a shift in market sentiment to the downside.
If this persists, look for more downside in Junk and other risky assets.
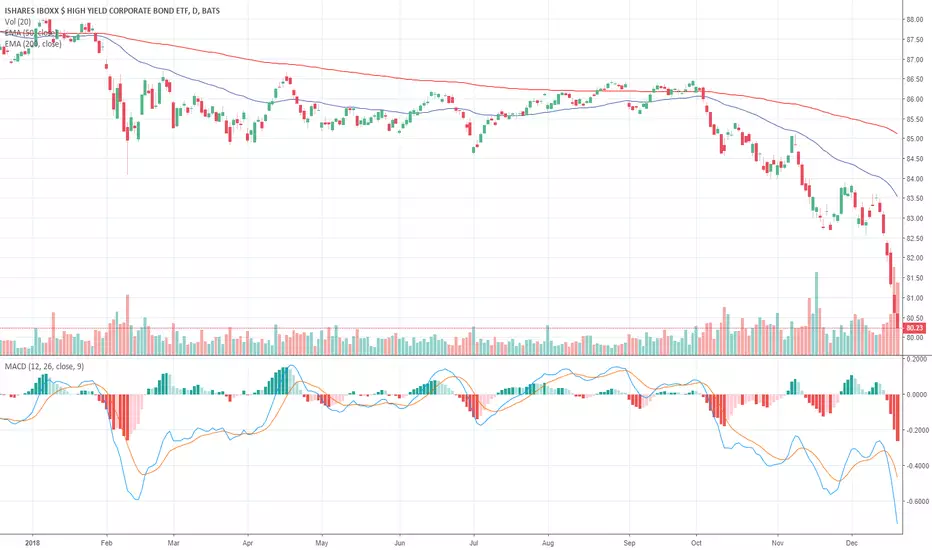

THE REAL REASON HE MARKET IS CRASHING THE REAL PANIC IS NEAR THIS IS A CHART OF THE HIGH YIELD MARKETS FOR THE LAST YEAR PLUS THE WARING SIGNAL . IF WE BREAK THIS THEN THE ODDS OF A REAL CRASH IN THE SP IS AT 100 % AND THAT MY PANIC CYCLE DUE DEC 11 WILL HAVE MINOR SHIFT TO DEC 29 AND THEN A FINAL WASH INTO THE NEXT SPIRAL DUE JAN 14 FROM MY SPIRAL OF 4/2/ 2018 WE THEN SEE A WORLD WIDE DEPRESSION

Trade promises don't solve credit issues and bonds don't lieHYG is bearish and price is back to an optimal sell level.
Btw why do you think US 2y/5y yield spread is tradig negative (inverted curve) and 2y/10y flattened to 13,6 basis points???
The alarm is ringing louder.
No more comments.
