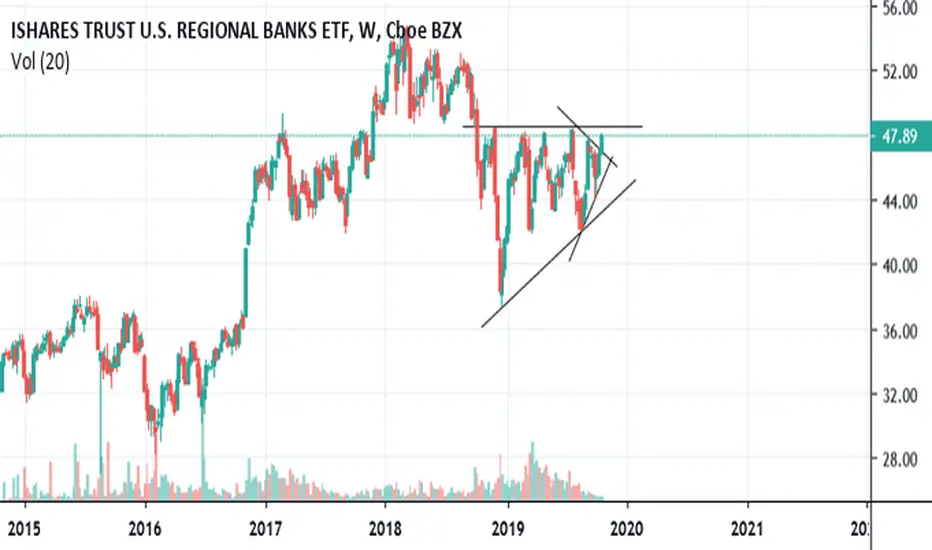
Buy US Regional Bank for catch upUS equities are at all time highs, but this is largely driven by bluechip tech stocks (AAPL, MSFT, GOOG etc...), which indicates investors are still cautious going for the safe bets or passive index investing.
Further improvement in sentiment should support deep value plays such as regional banks.
Key stats
About iShares U.S. Regional Banks ETF
Home page
Inception date
May 1, 2006
Structure
Open-Ended Fund
Replication method
Physical
Dividend treatment
Distributes
Distribution tax treatment
Qualified dividends
Income tax type
Capital Gains
Max ST capital gains rate
39.60%
Max LT capital gains rate
20.00%
Primary advisor
BlackRock Fund Advisors
Distributor
BlackRock Investments LLC
IAT specifically targets small- and mid-cap regional banks, creating a portfolio with a significant small-cap tilt compared to the broader banking market. Like the sector itself, this fund is extremely concentrated. IAT's underlying index selects from the small and midsize stocks of the Dow Jones U.S. Bank Index: It excludes mega-caps such as JP Morgan and Wells Fargo from the get-go. A company is also excluded if its three-year average total assets account for more than 5% of the three-year average total assets of the index selection universe. This size caveat aside, IAT offers market-like exposure as nearly all of its holdings overlap with our neutral benchmark. The index is market cap-weighted and is rebalanced quarterly.
Related funds
Classification
What's in the fund
Exposure type
Finance
Stock breakdown by region
Top 10 holdings

$IAT Blam, broke out over the wedge from my chart 2 weeks agoIt made some bullish moves over the last 2 weeks, kudos to those who took the trade.

$IAT Trying to break out, needs to break top trend line as wellLooking for some good buy volume to push this one above the top trend line.
$IAT Large move coming soon, has been consolidating for a while.This one has been consolidating for a while, with the dollar losing ground, could be a bounce coming.

$IAT Beautiful wedge break, and there it went.Another nice breakout from the wedge, still pushing up with plenty of volume.
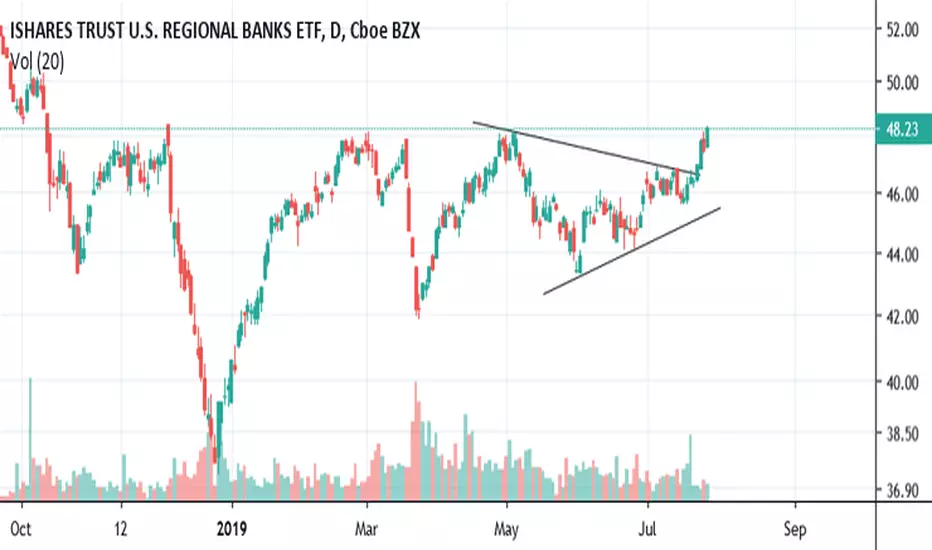


$IAT Nice tightening wedge here, plus the IH&S, watching.Looks promising here, let's see how this wedge and IH&S plays out.

Reginional Banks: One to consider and watchChart looks promising to me . Nice Positive reversal in the weekly RSI (dashed line). But the daily chart looks overbought and right at resistance points with a potential bearish divergence in the RSI. So would not be surprised to see a small pullback here which would improve the risk benefit ra


See all ideas
Summarizing what the indicators are suggesting.
Oscillators
Neutral
SellBuy
Strong sellStrong buy
Strong sellSellNeutralBuyStrong buy
Oscillators
Neutral
SellBuy
Strong sellStrong buy
Strong sellSellNeutralBuyStrong buy
Summary
Neutral
SellBuy
Strong sellStrong buy
Strong sellSellNeutralBuyStrong buy
Summary
Neutral
SellBuy
Strong sellStrong buy
Strong sellSellNeutralBuyStrong buy
Summary
Neutral
SellBuy
Strong sellStrong buy
Strong sellSellNeutralBuyStrong buy
Moving Averages
Neutral
SellBuy
Strong sellStrong buy
Strong sellSellNeutralBuyStrong buy
Moving Averages
Neutral
SellBuy
Strong sellStrong buy
Strong sellSellNeutralBuyStrong buy
Displays a symbol's price movements over previous years to identify recurring trends.
Frequently Asked Questions
An exchange-traded fund (ETF) is a collection of assets (stocks, bonds, commodities, etc.) that track an underlying index and can be bought on an exchange like individual stocks.
IAT trades at 46.97 USD today, its price has risen 0.97% in the past 24 hours. Track more dynamics on IAT price chart.
IAT net asset value is 46.96 today — it's fallen 2.13% over the past month. NAV represents the total value of the fund's assets less liabilities and serves as a gauge of the fund's performance.
IAT assets under management is 607.00 M USD. AUM is an important metric as it reflects the fund's size and can serve as a gauge of how successful the fund is in attracting investors, which, in its turn, can influence decision-making.
IAT price has fallen by −1.24% over the last month, and its yearly performance shows a 17.96% increase. See more dynamics on IAT price chart.
NAV returns, another gauge of an ETF dynamics, have risen by −2.13% over the last month, have fallen by −2.13% over the last month, showed a 1.67% increase in three-month performance and has increased by 21.19% in a year.
NAV returns, another gauge of an ETF dynamics, have risen by −2.13% over the last month, have fallen by −2.13% over the last month, showed a 1.67% increase in three-month performance and has increased by 21.19% in a year.
IAT fund flows account for 12.31 M USD (1 year). Many traders use this metric to get insight into investors' sentiment and evaluate whether it's time to buy or sell the fund.
Since ETFs work like an individual stock, they can be bought and sold on exchanges (e.g. NASDAQ, NYSE, EURONEXT). As it happens with stocks, you need to select a brokerage to access trading. Explore our list of available brokers to find the one to help execute your strategies. Don't forget to do your research before getting to trading. Explore ETFs metrics in our ETF screener to find a reliable opportunity.
IAT invests in stocks. See more details in our Analysis section.
IAT expense ratio is 0.40%. It's an important metric for helping traders understand the fund's operating costs relative to assets and how expensive it would be to hold the fund.
No, IAT isn't leveraged, meaning it doesn't use borrowings or financial derivatives to magnify the performance of the underlying assets or index it follows.
In some ways, ETFs are safe investments, but in a broader sense, they're not safer than any other asset, so it's crucial to analyze a fund before investing. But if your research gives a vague answer, you can always refer to technical analysis.
Today, IAT technical analysis shows the buy rating and its 1-week rating is buy. Since market conditions are prone to changes, it's worth looking a bit further into the future — according to the 1-month rating IAT shows the buy signal. See more of IAT technicals for a more comprehensive analysis.
Today, IAT technical analysis shows the buy rating and its 1-week rating is buy. Since market conditions are prone to changes, it's worth looking a bit further into the future — according to the 1-month rating IAT shows the buy signal. See more of IAT technicals for a more comprehensive analysis.
Yes, IAT pays dividends to its holders with the dividend yield of 3.17%.
IAT trades at a premium (0.02%).
Premium/discount to NAV expresses the difference between the ETF’s price and its NAV value. A positive percentage indicates a premium, meaning the ETF trades at a higher price than the calculated NAV. Conversely, a negative percentage indicates a discount, suggesting the ETF trades at a lower price than NAV.
Premium/discount to NAV expresses the difference between the ETF’s price and its NAV value. A positive percentage indicates a premium, meaning the ETF trades at a higher price than the calculated NAV. Conversely, a negative percentage indicates a discount, suggesting the ETF trades at a lower price than NAV.
IAT shares are issued by BlackRock, Inc.
IAT follows the DJ US Select / Regional Banks. ETFs usually track some benchmark seeking to replicate its performance and guide asset selection and objectives.
The fund started trading on May 1, 2006.
The fund's management style is passive, meaning it's aiming to replicate the performance of the underlying index by holding assets in the same proportions as the index. The goal is to match the index's returns.