Now ya know Better hold then the SPY etf. Dividen + Percentage wise .03% more activity... dollars and cents.Longby McllroyCharleeUpdated 5
Example of Uptrend ChannelIn this moment I use a ETF IVV to show a uptrend channel. Educationby danieldjesus0
Example of uptrend ChannelIn this moment I use a ETF IVV to show a uptrend channel. Educationby danieldjesus0
IVV In the midst of a downward trend of downward momentum flow.19-JUL www.pretiming.com Investing position: In Falling section of high risk & low profit S&D strength Trend: In the midst of a downward trend of strong downward momentum price flow marked by temporary rises and strong falls. Today's S&D strength Flow: Supply-Demand strength has changed from a weak selling flow to a suddenly strengthening selling flow. Forecast D+1 Candlestick Color : RED Candlestick %D+1 Range forecast: 0.3% (HIGH) ~ -0.4% (LOW), -0.1% (CLOSE) %AVG in case of rising: 0.9% (HIGH) ~ 0.0% (LOW), 0.8% (CLOSE) %AVG in case of falling: 0.2% (HIGH) ~ -0.8% (LOW), -0.6% (CLOSE)by pretiming4
IVV - is where the end of SPX technical reboundLet's take a look on iShares IVV ETF that tracks SPX. Technical rebound is about the end. Decline is next. Shortby Pandorra882
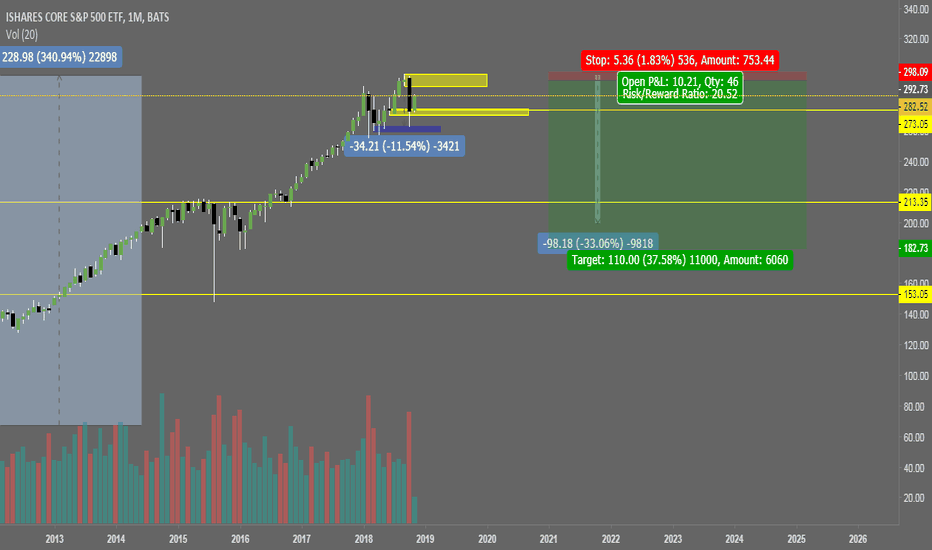
IVVI am expecting a bounce up to the top yellow box then down side break above and HTF close above yellow box would invalidate.Shortby Wellyahknow0
Symmetric triangle pattern in IVV This is a Symmetric triangle pattern in IVV This publication is of an academic nature. Orlando Enrique Fajardo Ocarizby orlandofajardo852
HOMEWORK: RISING WEDGE IVVThe rising wedge pattern is characterized by a chart pattern which forms when the market makes higher highs and higher lows with a contracting range. When this pattern is found in a downtrend, it is considered a bearish pattern. Educationby gsesma5
Symmetrical triangle. IVV ETFSymmetrical triangle, Ishares core S&P 500 ETF IVV Projection: a-b distance. Longby andimillan962
S&P50017/18 sep FOCM....=are entering a lame-duck period now through January=will be the last jump....Longby Pereat0