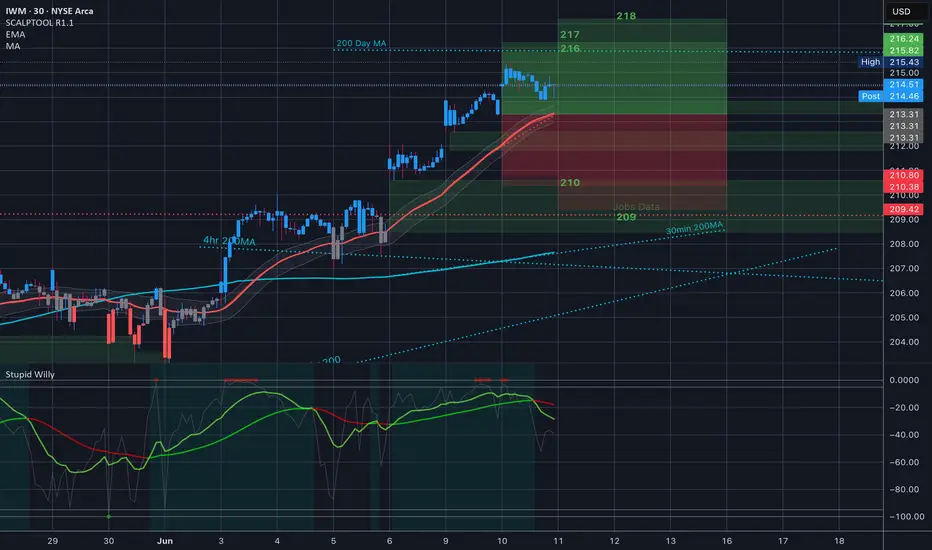
$IWM // June 10 2025 // Analysis & Targets for Day Traders
IWM gapped up for the third trading session in a row. That 200Day Moving average is clearly the target.
IWM trade ideas
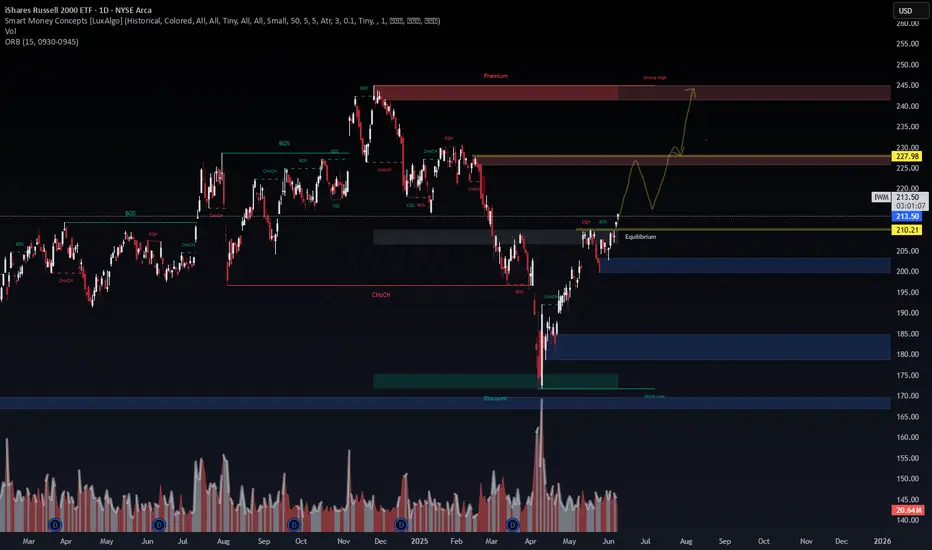
IWM Technical Outlook: Small Caps Poised for Ascent?📅 1D Chart | SMC | BOS/CHoCH | FVG Zones | ORB (0930–0945)
Price: $213.50 | Volume: 20.64M
The Russell 2000 ETF (IWM) is pushing into the equilibrium zone after a clean Break of Structure (BOS) from the mid-May lows. This rally signals regained bullish intent, but macro and liquidity overhead remain the key challenges.
🔍 Technical Breakdown:
🟩 Current Zone: Sitting at $213.50 near equilibrium
🟨 First Supply Zone (Reaction Expected): ~$227.98–$230
🟥 Strong High/Final Target Zone: $243–$250 (Premium)
Key Confluence:
CHoCH into BOS confirms structure shift
Volume decreasing slightly—awaiting re-accumulation before next leg
🧠 Probabilistic Positioning:
📈 Bullish Continuation (65%):
Pullback toward $210–213 zone (equilibrium) before reclaiming higher resistance. Strong move likely if macro sentiment aligns (Fed pause, rate-cut optimism).
📉 Bearish Rejection (35%):
Failure to hold $210 leads to re-tests of:
$200 zone (OB/FVG)
Extended: $186–$175
🌐 Macro Context:
Small-caps are interest rate-sensitive. With markets pricing fewer hikes and potential cuts into late 2025, capital rotation into risk assets may continue.
GDP revision and ISM Services softness support risk-on flows. However, real yields remain sticky, capping aggressive upside.
🎯 Trade Setup:
Entry Zone: $210–213.50
Target 1: $227.98
Target 2: $243+
Invalidation: Close below $210 (re-enter lower OBs)
🔒 Risk-to-Reward: ~1:3 on breakout retest scenario
📌 Conclusion:
IWM is climbing the risk ladder with structure and volume backing it. Watch for reaction at the mid-supply zone ($228–230). A clean break above could validate a move toward the premium zone.
#IWM #Russell2000 #SmartMoneyConcepts #TechnicalAnalysis #VolumeProfile #FVG #MarketStructure #TradingView #MacroOutlook #BOS #SMC #Equilibrium #RiskReward
IWM - 3 months HEAD & SHOULDERS══════════════════════════════
Since 2014, my markets approach is to spot
trading opportunities based solely on the
development of
CLASSICAL CHART PATTERNS
🤝Let’s learn and grow together 🤝
══════════════════════════════
Hello Traders ✌
After a careful consideration I came to the conclusion that:
- it is crucial to be quick in alerting you with all the opportunities I spot and often I don't post a good pattern because I don't have the opportunity to write down a proper didactical comment;
- since my parameters to identify a Classical Pattern and its scenario are very well defined, many of my comments were and would be redundant;
- the information that I think is important is very simple and can easily be understood just by looking at charts;
For these reasons and hoping to give you a better help, I decided to write comments only when something very specific or interesting shows up, otherwise all the information is shown on the chart.
Thank you all for your support
🔎🔎🔎 ALWAYS REMEMBER
"A pattern IS NOT a Pattern until the breakout is completed. Before that moment it is just a bunch of colorful candlesticks on a chart of your watchlist"
═════════════════════════════
⚠ DISCLAIMER ⚠
Breakout Area, Target, Levels, each line drawn on this chart and any other content represent just The Art Of Charting’s personal opinion and it is posted purely for educational purposes. Therefore it must not be taken as a direct or indirect investing recommendations or advices. Entry Point, Initial Stop Loss and Targets depend on your personal and unique Trading Plan Tactics and Money Management rules, Any action taken upon these information is at your own risk.
═════════════════════════════


IWM Long Term TargetIWM Weekly chart is very bullish IMNO. Confirmation of the INV H&S. Measured target posted

$IWM Major bottormAs you can see the market has been slowing plattoing at this area, while AMEX:IWM has been underperforming AMEX:SPY and NASDAQ:QQQ , there are 2 different scenarios that can play out.
1. Either this will break the major lower grey trendline and look like HSI:HSI , which means that the whole US market will enter a massive long term recession.
2. Or market reneters an new era of this 3-4 year bull market where the AMEX:IWM severly outperfoms the MEGA 7.
Now why is 2. the most probable. Because of basic EW pattern , trendline major support , volume building and that all major index funds are in the process of breaking out.
Now the big question is whether this is the best price you will get , or more techincally, whether we are going to get another touch on the lower major support trendline before starting the new 5 wave pattern.
As you can see from the white paint on my chart(yes i am a painter), we can see that supports on that line only come on the major EW pattern, therefore the next lower high will not be on the lower trendline, but just one above as shown at the foreshadowing EW i have on the graph.
thanks for reading

Cycle shifts don’t happen overnightCycle shifts don’t happen overnight!
Long-term inflation fears have been growing since October 2022,
Recent tariff announcements have amplified these concerns, adding uncertainty and potentially raising costs for U.S. goods.
#Pirri

$IWM / May 27 2026 CONTRACT / Analysis & Targets for Day Traders
Only the first contract of the week will be public. GL today, y'all...

Market Update - 5/25/2025• Clear leading sectors are batteries, nuclear and alternative energy, material and metal names especially gold
• Breadth is declining, XLU, XLP outperforming, stocks lower, IWM rejected from the 100dma.
• These are all clear signals to me that we are in a bad environment. Last week I was 109% invested, but now down to only 10%, and only risking 0.3% on my trades. I'm fully in defensive mode. I'm only focusing on the best of the best setups in the above mentioned leading industries. I'm expecting weakness ahead

IWM: Post Market at 206.65 must be a bargaining match. Aftermarket traders joins the party. Any business idea's welcome!

IWM: Manipulation Accumulation and Trend Let’s see how the market reacts. We may open with a gap down or a gap up—next week will reveal the direction or at least offer a hint of what’s to come.

Russel 2000 Weekly PotentailVolatility, expressed through standard deviation, quantifies market elasticity and presents a level of probability and precision that humbles us all.
This week with AMEX:IWM you can see that last week trending bi-weekly markets were more volatile than our monthly trending values. This could indicate regression to quarterly means, but for now shows a 15.02% premium advantage over current IV per move.
Bi-weekly, is as of now, only 10.81% off it's quarterly trend. However, it's important to observe that volatility can still consolidate under monthly in a poetic dance to coil up the monthly more on it's path in regression.
This is why in my charts you will notice a 'coiling' value under both HV10 and HV21 values.
BOOST the post, drop a follow and comment, BUT don't forget to circle back at the end of the week to revisit and observe how our trending markets preformed!

IWM INVENTED HEAD N SHOULDER TARGET .786 /alt 618 We have now pulled back in what should be an abc drop The question is as we stop at the 50 % mark I tend to see another advance to the .618 and most likely .786 . I see the bond market decline as ready to turn UP rather big . This should help rally ALL Boats . We also had a nice 5 waves down under the bearish alt wave count . This should be good for the .618 .But one wave at a time . Wavetimer

IWM: Could Be a Gap Fill Day Today🔍 Posted by WaverVanir International LLC
Looking at IWM on the 15-minute chart, price action remains ambiguous — we’re caught in a range where traditional technical indicators are providing limited directional clarity.
However, our proprietary Decision Support System (DSS) is signaling a potential move based on LSTM (Long Short-Term Memory) model outputs. While human sentiment and chart structure may hesitate, machine learning is beginning to lean bullish.
🔹 Key Notes:
No clear breakout yet from this consolidation zone.
Volume remains subdued, signaling indecision.
LSTM forecasting engine from our DSS suite is tilting slightly bullish over the next 1–2 hours.
Awaiting confirmation from VWAP and liquidity sweeps before a higher conviction entry.
⚠️ Short-term traders: stay nimble. Machine guidance suggests preparing for a breakout, but price confirmation is critical.
🧠 “When human emotion falters, data continues.”
— WaverVanir DSS

Trend Line in Play - Imminent Advance in Small Caps?Small Caps look the least extended in this equity rally and I really like the tight ranges before it advances to it's next box. My analysis puts IWM imminent on its next advance upwards. Put this trade idea under: "The trend is your friend until it bends".

$IWM // May 19 2026 // Analysis & Targets for Day TradersAMEX:IWM // May 19 2026 // Analysis & Targets for Day Traders

IWM: Let's see we get this position :D I won't celebrate early, but I will be cautious, and watchout for the trap. The sell is set at 10:30. I Have $100 backup might go all in today.


I am betting big on this. Let's see what we get. My Ai is not working right now so working. I don't know how to explain but I see the double top structure forming there. Maybe we see a pump today?

$IWM // May 16 2026 // Analysis & Targets for Day TradersAMEX:IWM // May 16 2026 // Analysis & Targets for Day Traders
This is for the May 16th contract.
Full Walkthrough on this mornings video

$IWM Analysis, Key Levels & Targets for Day Traders // May 15 25AMEX:IWM Analysis, Key Levels & Targets for Day Traders // May 15 25
Let's go, we had PPI in premarket w// Powell... Today's range looks fun.

IWM: Going to pump? Quick trade setup**IWM 15m – Smart Money Concepts + ORB Breakdown**
_Published by WaverVanir_International_LLC on May 14, 2025_
**Setup**
- ORB (09:30–09:45) established supply at **209.30** (Weak High) and demand near **206.62–206.27**.
- Smart Money Concepts zones:
- **Premium (Supply):** 209.30
- **Equilibrium (Fair Value):** 208.52
- **Discount (Demand):** 206.57–206.21
**Price Action**
1. **Break of Structure (BOS)** below the recent consolidation low signals bearish continuation.
2. Retracement tested the **38.2–61.8% Fibonacci** levels (~208.67–208.09), aligning with Equilibrium (Investopedia, n.d.-a).
3. Failed reclaim of Premium confirms seller strength.
**Trade Plan**
- **Entry:** Short on bounce failure at Equilibrium (~207.80)
- **Stop-Loss:** Above Premium (209.30)
- **Targets:**
1. Discount Zone: 206.57–206.21
2. Extended: 205.71 (1.618 Fib)
**Risk/Reward:** ≥2:1
Stay disciplined—only trade with defined risk. GLTA! 🚀
