iShares Global Energy ETF - $IXC - Major OpportunityiShares Global Energy ETF - AMEX:IXC
This chart and all the others ETF's shared in the below post continue to show major break outs. Its really incredible to see.
✅ Ascending triangle breakout & retest of base
✅ Series of higher lows
✅ Above 200 day SMA
✅ Great Risk Reward set up at 8:1
Garnering some long term exposure to these general indexes is a great way to ride the general Global, Energy, Fintech and blockchain trend. Not included in the below is a potential commodity bull cycle that feeds into it.
IXC trade ideas
Energy stocks and ETF will continue to rallyIF you for some reasons are lost and confused finding the right Energy companies to buy, then a global Energy ETF might be suitable. It saves you the hassle of scrutinising the financial performance of the companies and allows you a bigger birds eye view of the global market.
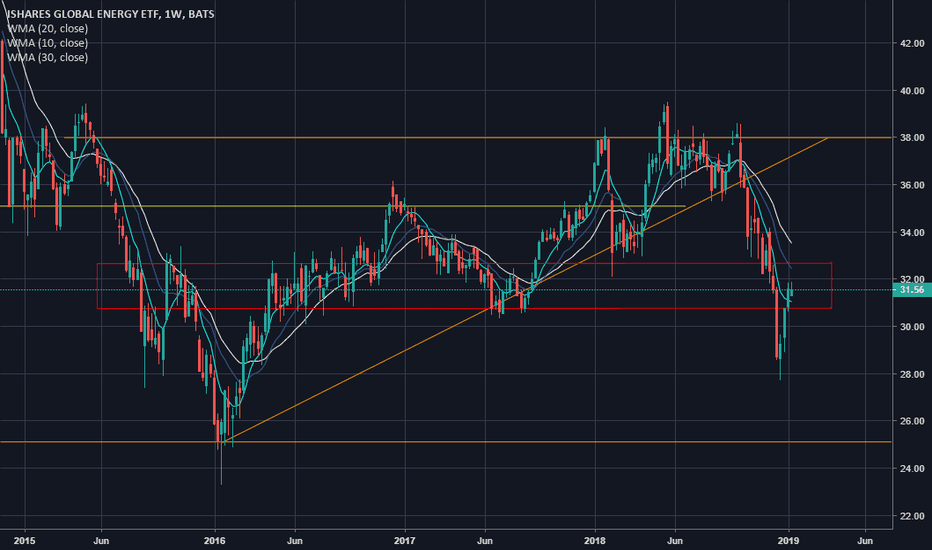
[ENERGY ETF] AWAITING BREAKOUTThis ETF has been falling constantly on the weekly chart as it is waiting for its exhaustion stage to retest the 20 or 30 Day WMA. It could possibly reverse all together and starting its bull trend relative to the volume. For the last week or so it has been trapped and seem to be consolidating. I have projected here the paths if the ETF breaks both the $31.79 and the $31.37 levels. Oil has gained so far this year but has shown now strong signs of a bull reversal.
[TRAPPING THE PRICE] *ENERGY ETF*Finding different weekly support and resistance levels dating back to 2008. I am marking levels that have confirmed the price getting caught in, then when breaking either up or down it will continue that way for a short period of time. Next I will show a daily projection based off of the levels I have found.


