Global Tech on a DowntrendGlobal tech has broken the long term uptrend against the MSCI world. Might be time to be underweight...
Key stats
About iShares Global Tech ETF
Home page
Inception date
Nov 12, 2001
Structure
Open-Ended Fund
Replication method
Physical
Dividend treatment
Distributes
Distribution tax treatment
Qualified dividends
Income tax type
Capital Gains
Max ST capital gains rate
39.60%
Max LT capital gains rate
20.00%
Primary advisor
BlackRock Fund Advisors
Distributor
BlackRock Investments LLC
IXN tracks an index of information technology stocks, as classified by GICS, that are contained in the broader S&P Global 1200 Index. The sub-index provides exposure to stocks of all market capitalizations from around the globe within the electronics, computer software and hardware, and information technology industries. Holdings are market cap-weighted, subject to capping, which limits single security weights to 22.5% and the aggregate of all securities by an issuer exceeding 4.5% to be capped at 45%. The index is rebalanced quarterly in March, June, September, and December. Prior to Mar. 20, 2023, the IXN tracked &P Global 1200 Information Technology Index.
Related funds
Classification
What's in the fund
Exposure type
Electronic Technology
Technology Services
Stock breakdown by region
Top 10 holdings

What "Tech Bubble"?Global Tech companies made a great comeback since giving brave investors the best Christmas (time of Low) 2018 gift ever. ISHARES TRUST GLOBAL TECH ETF now approaching its all time highs the ETF made in August & October last year (2018). Nice little inverse head and shoulders developed, confirming t
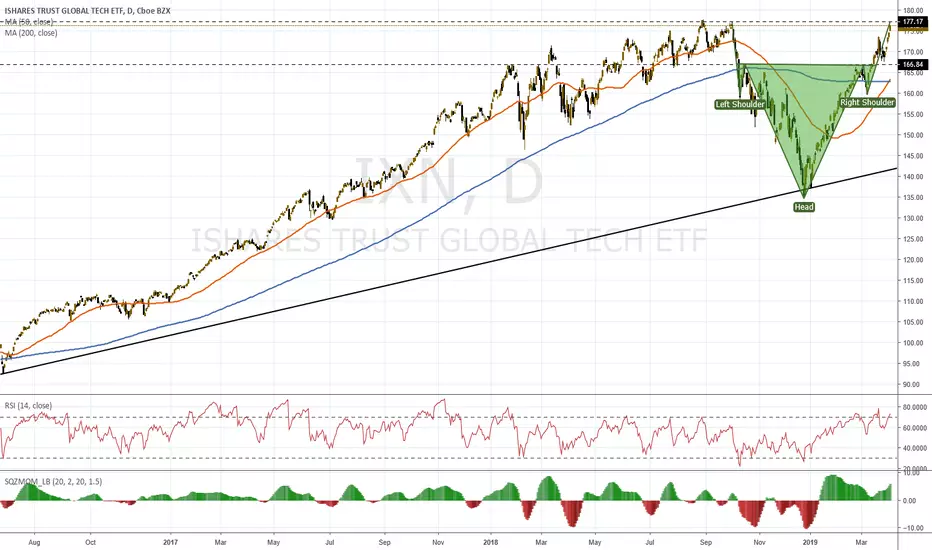
The "Tech Bubble" just got BiggerGlobal Tech companies making a great comeback since giving brave investors the best Christmas (time of Low) 2018 gift ever. ISHARES TRUST GLOBAL TECH ETF now approaching its 200-day moving average at $162.91. Nice little inverse head and shoulders devolping, confirming the reversal in the downtrend.

See all ideas
Summarizing what the indicators are suggesting.
Oscillators
Neutral
SellBuy
Strong sellStrong buy
Strong sellSellNeutralBuyStrong buy
Oscillators
Neutral
SellBuy
Strong sellStrong buy
Strong sellSellNeutralBuyStrong buy
Summary
Neutral
SellBuy
Strong sellStrong buy
Strong sellSellNeutralBuyStrong buy
Summary
Neutral
SellBuy
Strong sellStrong buy
Strong sellSellNeutralBuyStrong buy
Summary
Neutral
SellBuy
Strong sellStrong buy
Strong sellSellNeutralBuyStrong buy
Moving Averages
Neutral
SellBuy
Strong sellStrong buy
Strong sellSellNeutralBuyStrong buy
Moving Averages
Neutral
SellBuy
Strong sellStrong buy
Strong sellSellNeutralBuyStrong buy
Displays a symbol's price movements over previous years to identify recurring trends.
Frequently Asked Questions
An exchange-traded fund (ETF) is a collection of assets (stocks, bonds, commodities, etc.) that track an underlying index and can be bought on an exchange like individual stocks.
IXN trades at 92.84 USD today, its price has risen 0.41% in the past 24 hours. Track more dynamics on IXN price chart.
IXN net asset value is 92.55 today — it's risen 6.93% over the past month. NAV represents the total value of the fund's assets less liabilities and serves as a gauge of the fund's performance.
IXN assets under management is 5.60 B USD. AUM is an important metric as it reflects the fund's size and can serve as a gauge of how successful the fund is in attracting investors, which, in its turn, can influence decision-making.
IXN price has risen by 7.15% over the last month, and its yearly performance shows a 7.54% increase. See more dynamics on IXN price chart.
NAV returns, another gauge of an ETF dynamics, have risen by 6.93% over the last month, showed a 37.60% increase in three-month performance and has increased by 8.26% in a year.
NAV returns, another gauge of an ETF dynamics, have risen by 6.93% over the last month, showed a 37.60% increase in three-month performance and has increased by 8.26% in a year.
IXN fund flows account for −190.28 M USD (1 year). Many traders use this metric to get insight into investors' sentiment and evaluate whether it's time to buy or sell the fund.
Since ETFs work like an individual stock, they can be bought and sold on exchanges (e.g. NASDAQ, NYSE, EURONEXT). As it happens with stocks, you need to select a brokerage to access trading. Explore our list of available brokers to find the one to help execute your strategies. Don't forget to do your research before getting to trading. Explore ETFs metrics in our ETF screener to find a reliable opportunity.
IXN invests in stocks. See more details in our Analysis section.
IXN expense ratio is 0.41%. It's an important metric for helping traders understand the fund's operating costs relative to assets and how expensive it would be to hold the fund.
No, IXN isn't leveraged, meaning it doesn't use borrowings or financial derivatives to magnify the performance of the underlying assets or index it follows.
In some ways, ETFs are safe investments, but in a broader sense, they're not safer than any other asset, so it's crucial to analyze a fund before investing. But if your research gives a vague answer, you can always refer to technical analysis.
Today, IXN technical analysis shows the buy rating and its 1-week rating is buy. Since market conditions are prone to changes, it's worth looking a bit further into the future — according to the 1-month rating IXN shows the buy signal. See more of IXN technicals for a more comprehensive analysis.
Today, IXN technical analysis shows the buy rating and its 1-week rating is buy. Since market conditions are prone to changes, it's worth looking a bit further into the future — according to the 1-month rating IXN shows the buy signal. See more of IXN technicals for a more comprehensive analysis.
Yes, IXN pays dividends to its holders with the dividend yield of 0.40%.
IXN trades at a premium (0.01%).
Premium/discount to NAV expresses the difference between the ETF’s price and its NAV value. A positive percentage indicates a premium, meaning the ETF trades at a higher price than the calculated NAV. Conversely, a negative percentage indicates a discount, suggesting the ETF trades at a lower price than NAV.
Premium/discount to NAV expresses the difference between the ETF’s price and its NAV value. A positive percentage indicates a premium, meaning the ETF trades at a higher price than the calculated NAV. Conversely, a negative percentage indicates a discount, suggesting the ETF trades at a lower price than NAV.
IXN shares are issued by BlackRock, Inc.
IXN follows the S&P Global 1200 Information Technology 4.5/22.5/45 Capped Index - Benchmark TR Net. ETFs usually track some benchmark seeking to replicate its performance and guide asset selection and objectives.
The fund started trading on Nov 12, 2001.
The fund's management style is passive, meaning it's aiming to replicate the performance of the underlying index by holding assets in the same proportions as the index. The goal is to match the index's returns.