BTD on REITsKeeping it simple with a pitchfork idea on this REIT etf IYR . REITs and Utility stocks got sold off as traders rotated out of dividend stocks and into growth stocks. I believe a limit buy under $91 is a conservative entry with a sell limit near the middle of pitchfork . However, I'm leaning towards a credit put spread at $91/$90.5 3-4 weeks out. Keep the TNX on watch for negative correlation effects on IYR .
IYR trade ideas


PSA: Real Estate Investors, You've Been Made Whole AgainThink there are actually some very positive secular trends in real estate's favor going forward, could continue to perform in the years ahead.


IYR-RealEstate- Double Checked 3 Hr Model - Confirms Oct2021 LowIYR-RealEstate- Double Checked 3 Hr Model - Confirms Oct2021 Low
Elliott Wave View: IYR New All-Time-High in SightIYR is the ticker symbol for U.S. Real Estate ETF. Since the financial crash in 2009, the instrument is steadily rising and currently only $1 from breaking the 2007 all-time high. In the short term chart below, we can see the rally is unfolding as an 5 waves impulsive Elliott Wave structure. The impulsive rally started from August 5, 2019 low where wave ((i)) ended at 92.66 and wave ((ii)) ended at 90.75. Wave ((iii)) is in progress and unfolding as another impulse Elliott Wave structure in lesser degree.
A 100% Fibonacci extension measurement from August 5 gives us a possible short term target of 96.45 – 97.8. This can be a possible short term target to the upside. Near term, while pullback stays above 90.76, expect the instrument to extend higher. We do not like selling the instrument. Dips should find buyers in 3, 7, or 11 swing as far as pivot at 90.76 low stays intact. In the larger degree, if IYR makes all-time high by breaking above 2007 high (95), that should create a bullish sequence and open further upside in the larger degree.

Make a house a home. Adding this to my watch list.
REITs must distribute at least 90% of their taxable income annually to shareholders as dividends and distributions. At least 75% of the REITs’ assets must be in real estate, cash or U.S. Treasurys, with at least 75% of the income coming from rents, mortgages or other real estate investments.
This has a history of topping in July and Aug. Multi year high of 95.

Will My 2021 Real Estate Bottom Dream Materialize :) :) :)Will My 2021 Real Estate Bottom Dream Materialize :) :) :)

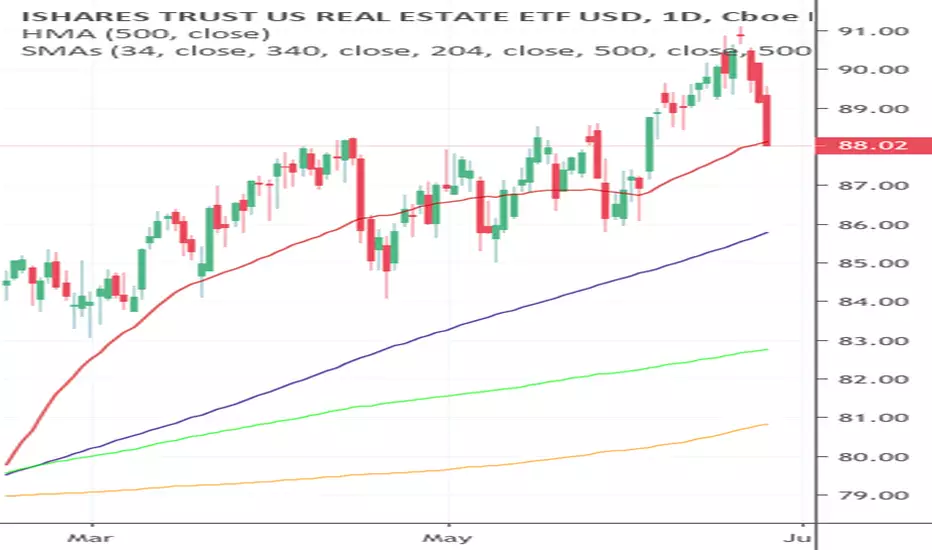
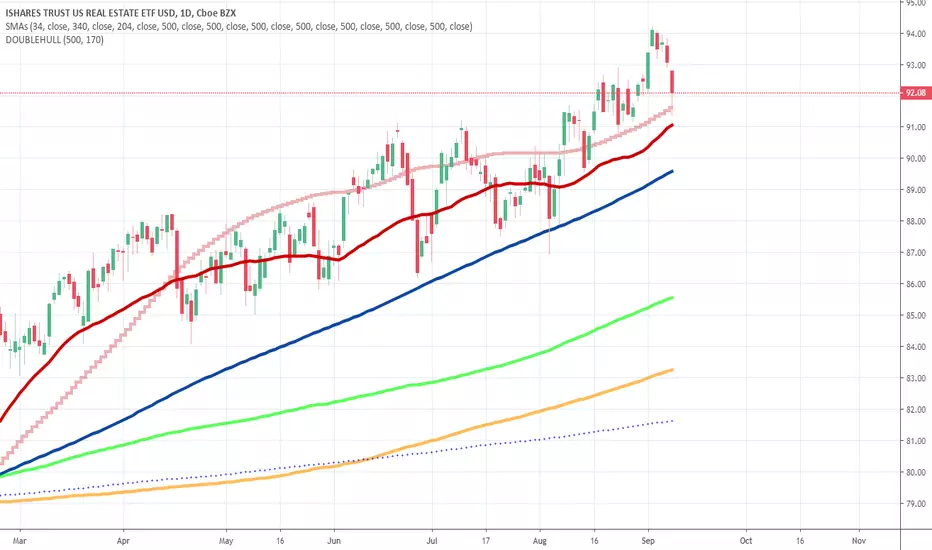
Most Important Moving Averages - SMA(34,204,340),Hulls(170,500)Most Important Moving Averages - SMA(34,204,340),Hulls(170,500)


Real estate cycle down$iyr $drn $drv
Pay close attention to real estate- It is due for a cycle low somewhere around early-mid 2020. Because the cycle peak is late, I would venture to say that the move downward could be accelerated. How low it goes should reveal how bearish (or bullish) it is.

Daily IYR stock forecast trend analysis 10-JUL
Price trend forecast timing analysis based on pretiming algorithm of Supply-Demand(S&D) strength.
Investing position: In Rising section of high profit & low risk
S&D strength Trend: About to begin an adjustment trend as a upward trend gradually gives way to a slowdown in rises and falling fluctuations
Today's S&D strength Flow: Supply-Demand strength has changed to a strengthening buying flow when stock market opening.
read more: www.pretiming.com
D+1 Candlestick Color forecast: GREEN Candlestick
%D+1 Range forecast: 0.5% (HIGH) ~ 0.0% (LOW), 0.2% (CLOSE)
%AVG in case of rising: 0.7% (HIGH) ~ -0.4% (LOW), 0.5% (CLOSE)
%AVG in case of falling: 0.3% (HIGH) ~ -0.9% (LOW), -0.4% (CLOSE)


$IYR Iron Butterfly OpportunityReal estate has been booming along with bonds recently because of the widely expected cut in the Fed funds rate in July. I think that this move has already priced in the rate cut, and so if rates are cut, price will move very little. The risk is that rates are not cut! Check out the AUG-23 weeklies for attractive pricing.


Maybe I'm wrong on real estate? Thought we are at Major PeakMaybe I'm wrong on real estate? Thought we are at Major Peak

I used to get laughed at for the "34 SMA", but I'm laughing now!I used to get laughed at for the "34 SMA", but I'm laughing now!

R.E.: Break 500, tag 204, hit 34 & drop? -perfect SHORT set up??R.E.Short: Break 500, tag 204, hit 34 & drop???

built another brschultz gold wave model pointing to Oct 2021 LowReal Estate to bottom in 2 years from now

The Ultimate Fight 4hr 34 v 500 Hull - Short Real EstateThe Ultimate Fight 4hr 34 v 500 Hull - Short Real Estate

Too Funny -Today’s Exec Order drops Real Estate Prices - Timing!Too Funny -Today’s Exec Order drops Real Estate Prices - Timing!