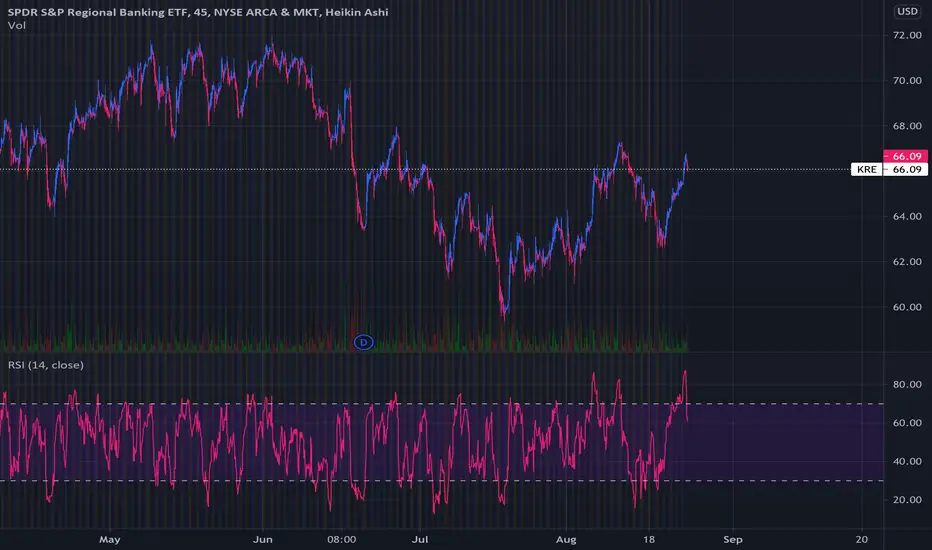
...But ...I was told the markets will crash nowWhy are regional banks breaking out to new 6 months highs relative to the S&P? Does smart money know something that retailers are missing?
KRE trade ideas

KRE - Regional Bank SpankWither the Banking Sector... by design.
All part of the Plan.
Larger Regional Banks will become the very next too-big-to-fail entities.
A good old-fashioned rollup, kinda like Bush Sr's criminal S&L Scandal Part tres.
_____________________________________________________________________
Bank on it.
A threat to financial stability?
M&A isn't going to go all too smoothly.

KRE - Regional Banks NQBANK XLFOh my, death on a stick once again.
Banks are twisting in the wind.
Health?
Hell No.
______________________________
Use the Dollar Tool now.
Forget Stonks they are cooked.
Markets go nowhere without Financials.
Homies' wreckage just beginning.
Bonds are already in ruin.
Crypto, ready for the beating.
Gold, a shiny useless rock.
22% more to go... adios.

6/1/22 KRESPDR S&P Regional Banking ETF ( AMEX:KRE )
Sector: Miscellaneous (Investment Trusts/Mutual Funds)
Market Capitalization: $--
Current Price: $63.44
Breakout price: $66.00
Buy Zone (Top/Bottom Range): $62.20-$56.55
Price Target: $90.00-$91.00
Estimated Duration to Target: 496-509d
Contract of Interest: $ZM 6/16/23 70
Trade price as of publish date: $4.70/contract

KRENot a good look for regional banks. Monthly close below previous highs. Slight bearish RSI divergence & MACD going negative. 50 sma next?

Opening: KRE April 14th 60/79 Short Strangle... for a 1.76 credit.
Comments: Popped to the top of my screener with an IVR of 95 and a 30-day of 45.1. Selling the 16 delta strikes for a 1.76 credit on buying power of 7.06; 24.9% ROC at max; 12.5% ROC at 50% max. Will look to take profit at 50% max, roll sides on approaching worthless/side test.

KRE Breakout - Target 81.33 , 86.74 , 94KRE has been consolidating in a channel for more than a year. Recently it gave a breakout from the channel and trying to retrace back to the trend line for breakout confirmation. With Fed planning to raise interest rates 3-4 times in 2022, all banking sector has gained momentum. Breakout moves could be explosive on the upside, targets 81.33 , 86.74 , 94 and beyond.

KRE long target 110$Fundamentals for the banking system are very strong right now, and it is possible to reach this target with the interest hikings

KRE weekly bullish breakout with volume ahead of bank earnings. KRE Weekly chart showing bullish break out to ATH with increasing volume.
Technical point to a more bullish move for up coming weeks ahead of bank earnings.
CCI & RSI trending higher and moving up to bullish signal.
Cross on weekly Stochastics RSI is showing a bullish cross.

KRE 3h Wolfe Wave 11/9A Wolfe Wave is a chart pattern composed of five wave patterns in price that imply an underlying equilibrium price. Investors who use this system time their trades based upon the resistance and support lines indicated by the pattern.

$KRE Weekly Box BreakoutAs mentioned in XLF idea, Financial charts looking bullish with a nice weekly box breakout. KRE regional banking etf :
- Look for retest of box or possible sellers to step in for a push down to 8EMA green line
- My bias and bull case - continuation , especially with the MACD bullish cross confluence.
I'm long Dec 72c but can also form a spread with the Dec 69p (.28 delta)

regionals risebanks rip more from here on a hawkish Jackson Hole fed meeting. rolled into some OTM calls today. RSI not in an ideal spot, altho the tighter charts show a different supportive picture atm
KRE Short SetupRegional Banks look terrible here and have shown relative weakness recently as the indices have been making new highs. If the market decides to correct, I expect KRE to see some more downside.

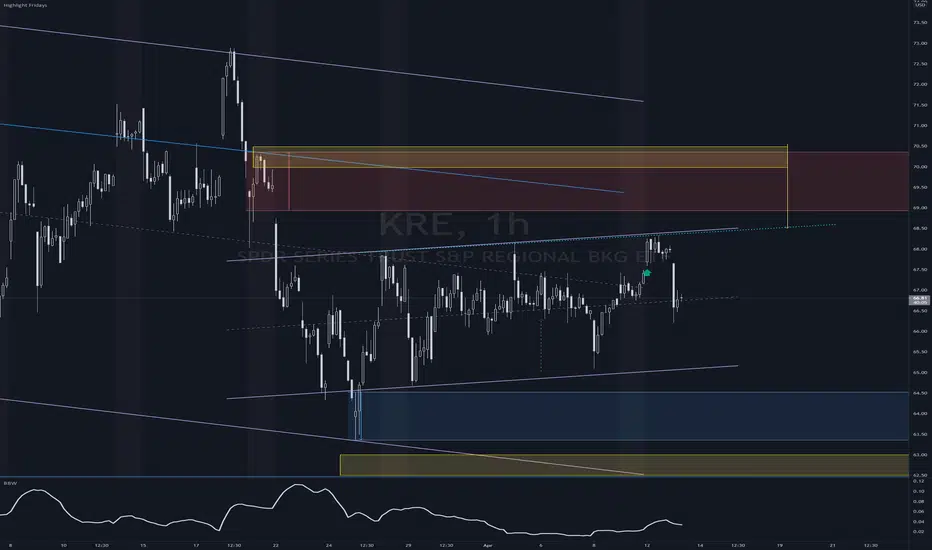
$spy $kre The line in the sand for Regional BanksI'm gonna state it like this in my Mr. T voice. announcer: What do you predict if kre drops below the blue support line? Mr. T.: Pain


KRE - Long on positive market conditions, risk 5%Financial sector looks pretty good, showing relative strength, despite choppy market. Nice wedge breakout on heavy volume, with excellent mirror support level retest. We are looking for 71.30 level breakout. SL 67.80

KRE call credit spread Apr 16 expiryKRE call credit spread - back logging entry, not at expiry yet
At likely channel high resistance
Driving in hard rally
The center line is well respected
Likely a -2 to +2 sigma move and then roll over
Danger is rally expansion after a consolidation so need short strike to be as high as possible
Aggressive sellers above in DBD supply zone
Short strike at 70 is at the distal edge of supply with a liquidity search rally spike just below it
Opened as 4 DTE, 19% ROI
Got the decline this morning and trade looks good for Fri expiration Apr 16
The Stars Align | Long Financials1. Steepening Yield Curve
2. High GDP Growth, which will boost loan growth
3. Lower credit losses supported by fiscal stimulus
4. Accelerating job growth, which should drive up consumer spending, improve credit outlooks further & enable accelerated reserve releases
5. Accelerating buy backs
*Fed to end its temporary restrictions on most banks paying dividends and buying back shares after June 30
Found support at the 50day (orange)
Stoch RSI, Buy signal

OPENING (IRA): KRE MARCH 19TH 42 SHORT PUT... for a 1.08/contract credit.
Notes: I already have some January on, and there is no February currently, so going out to March with 30-day still >35% at 36.5% and expiry specific at 38.4%. As with my other IRA short put trades, I'm fine with getting assigned, selling call against, particularly since it has a small dividend to pay you while you wait to exit any covered call profitably. ROC: 2.64% at max as a function of notional risk; 9.6% annualized at max.

OPENING (IRA): KRE JANUARY 15TH 40 SHORT PUT... for an .81/contract credit.
Notes: With 30-day at 57.4% and expiry-specific at 42.3%, selling premium in one of the underlyings on my IRA shopping list. (Current yield 3.02%). I would ordinarily just ladder out, but this isn't exactly weak relative to where it's been, so want to keep powder dry for it in the event it weakens further. 2.07% ROC at max as a functional of notional risk; 11.6% annualized.

Banks, Airlines & Cruises strong this morning.Just reposting a chart I sent out last week. All the names are up pre-market and threatening to breakout
from a decent base. Pretty much tells you the theme for today after the MRNA news.

KRE Threatening to breakout of 5 month range.Not sure why banks are moving here as yields are not popping but they look strong.

KRE vs TLTAre bond about to tank? KRE is threatening a range breakout just as bond pull into key support.
Could reverser quickly of course but something to watch.. Its been interesting to see bonds sell off as
the market sells off.
