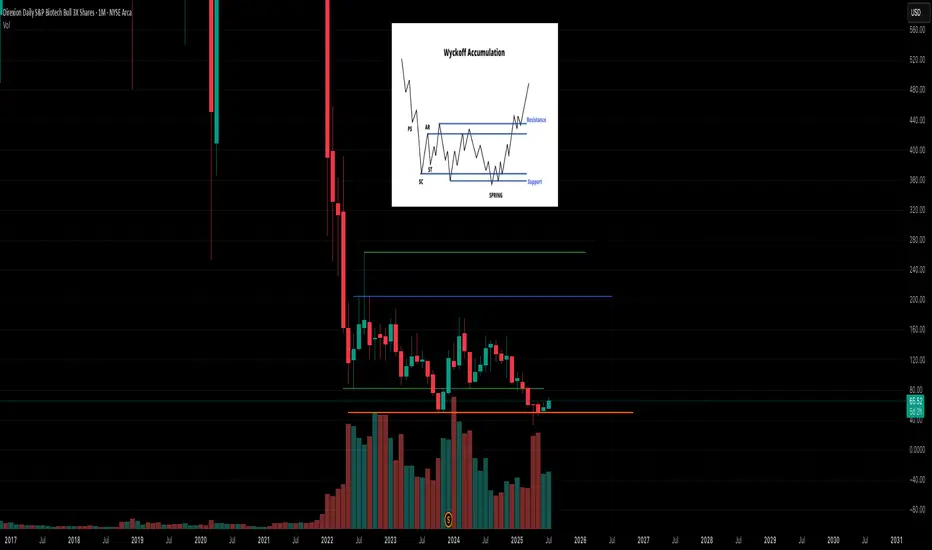
If you can hold for 2 years could be a nice entry around here haLooks to be in a very SLOW accumulation process. We will have a BIO-tech revolution it's inevitable; just make take years before it actually manifests in the sector. I have psoriasis and the should be a FKIN cure by now rofl. BS. AI will make it happen. MONTHLY CHARY
LABU trade ideas
NKE Pump to ~70The Pump & Dump King (PNDK) just announced they will be pumping and dumping
during press conference with Canadian PM Mark Carney.
The pump is happening Thursday or Friday.
Nike NKE sets up perfectly for a rally to ~70
May the Fork be with you!
NotTradingAdvice
YourOwnRisk
ResearchFractals
PitchForkTA
TheRoaring2020s
btc eth Crypto
@X3EM on BlueSky

LABU needs some love, i think it will get it soon.This setup is looking pretty nice. Has bounced almost every time at this support, I think it shall for the accumulation highs at my top line.

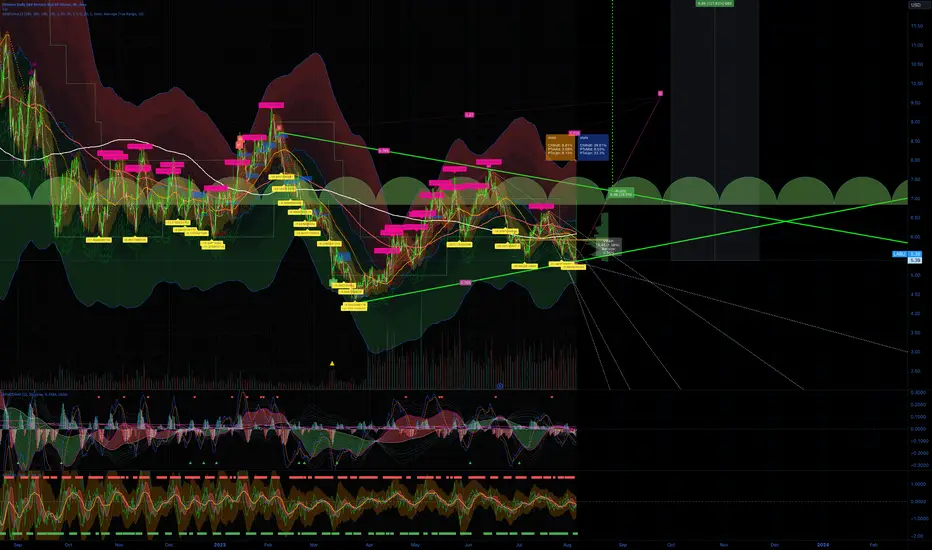
$LABU thesis on the weeklyThis is LABU that might go up to plus 200. I describe a little bit of my divergence technic and how it might be doing a higher low.

LONG LABUThere is a great potential reward to risk ratio on LABU that is trending in a parallel channel.
The idea is to buy at the bottom of the channel an sell at the top on un uptrend.
Buy 124
Stop loss 119 ((just below the most discernable low)
Take profit 149 (at the top of the channel that coincides with previous resistance)

$TSLA $LABU After open 8-19-24 Analysis Analysis of the after open on this day, explaining why I took profits and might be expecting a pullback to get in again.

LABU Stock Chart Fibonacci Analysis 032124Trading Idea
1) Find a FIBO slingshot
2) Check FIBO 61.80% level
3) Entry Point > 136/61.80%
1) Find a FIBO slingshot
2) Check FIBO 423.60% level
3) Hit the top = 57/423.60%
Chart time frame : B
A) 15 min(1W-3M)
B) 1 hr(3M-6M)
C) 4 hr(6M-1year)
D) 1 day(1-3years)
Stock progress : B
A) Keep rising over 61.80% resistance
B) 61.80% resistance
C) Hit the bottom
D) Hit the top
Stocks rise as they rise from support and fall from resistance. Our goal is to find a low support point and enter. It can be referred to as buying at the pullback point. The pullback point can be found with a Fibonacci extension of 61.80%. This is a step to find entry level. 1) Find a triangle (Fibonacci Speed Fan Line) that connects the high (resistance) and low (support) points of the stock in progress, where it is continuously expressed as a Slingshot, 2) and create a Fibonacci extension level for the first rising wave from the start point of slingshot pattern.
When the current price goes over 61.80% level , that can be a good entry point, especially if the SMA 100 and 200 curves are gathered together at 61.80%, it is a very good entry point.
As a great help, tradingview provide these Fibonacci speed fan lines and extension levels with ease. So if you use the Fibonacci fan line, the extension level, and the SMA 100/200 curve well, you can find an entry point for the stock market. At least you have to enter at this low point to avoid trading failure, and if you are skilled at entering this low point, with fibonacci6180 technique, your reading skill to chart will be greatly improved.
If you want to do day trading, please set the time frame to 5 minutes or 15 minutes, and you will see many of the low point of rising stocks.
If want to prefer long term range trading, you can set the time frame to 1 hr or 1 day.

LABU a 3X leveraged ETF of biotechnology stocks LONGLABU on a 240-minute chart has been in a trend up gaining 100% in 3 months. Both the fast and
slow ( green and red) are above the 50 level. Biotechnology is expected to be a hot subsector
this year as healthcare recovered further from the COVID pandemic anything from startups to
big pharma- from vaccines to new drugs for diabetes, liver disease and obesity. Leveraged
funds have time decay from the leveraging and management fees and are meant to be for
short-term trading. Nonetheless, 100% in 3 months is an excellent return. I add to my position
when I see a pullback on the 15-30 minute chart. If price rises more than 2% in a day I may
take 1-2 shares off the position to realize some profit and recycle ( compound) into the next
buy. According to those that follow sectors, LABU should outperform this year.


LABU / LABD Ratio Anchored VWAP over /under LABU LONGOn the weekly chart a LABU / LABD ratio is plotted with anchored VWAP bands and a volume
profile overlaid. I wanted to analyze this to affirm the highest of prospects for the
Biotechnology sector for 2024. LABU is triple leveraged Up while LABD is the inverse Down.
A good unleveraged biotech ETF is XBI. The chart shows LABU in a VWAP band and breakout
through the hohg volume area and then over it beginning early November. Unusually high
relative volume and volatility ramped up about the same time.
I readily conclude that LABU is the buy right now with the ratio rising. It is a low beat ETF
with good range due to the leveraging and high forecasts for 2024. I will make buys on
LABU at regular intervals on a 60-120 minute time frame looking for the weekly lows.
I will set an alert for a falling ratio on the 3H to daily chart to assess should the supertrend
fade. I believe that this will be a safe low risk swing long trade.

LABU - Potential 65% upsideLABU bottoming out - With the recent Nasdaq rally, Biotech hasn't performed at all.
Potential upside of 60% for a 3 month period ( Aug to Nov 2023)

LABU - One of my favorite Leveraged ETF
Reclaimed the breakdown level and now holding that level nicely.
Squeeze likely to start soon and push it to at least 5.5/6
If 3.4 is lost again, could test 3.0
I am long via commons at 3.50 today. Like the risk/reward here for a double up.

Changing direction?as you can see this could be a huge Symmetrical triangle, like in the case of Bitcoin and S&P this means a change of trend, and a potential 120%
LABU / LABD Medical Leveraged ETFs Flip Strategy.LABU is shown here on a 2H time frame. I am holding 500 shares having bought November 14th
on golden cross of fast and slow hull moving averages. The unrealized gain is 50%.
Here, I determine that I should en bloc or in increments close the position.
First, on the dual time RSI indicator of Chris Moody, the RSI is now over 60 and approaching
65. Price pivoted when RSI was in this range as shown by the red down arrows on the chart.
A fibonacci analysis is that the LABU downtrend of early September to late October has now
retraced in the range of 50% with the mid levels shown on the chart from the drawing tool.
Because of these two considerations, I believe that I should bank the 50% profit in less than
3 weeks and perhaps take a position in the inverse ETF LABD. I will do this on a 15 minute
time frame, take off one fifth of the position daily at the high of day as determined by an
alert for the faster Hull Moving Average doing down instead of upsloping. At the same time
on the LABD 15 minute chart I will buy a corresponding position at the low of day again using
an alert. By the end of the five days, the LABU position will be closed and the profits
redeployed into LABD. When LABD retraces 505 of its downtrend and RSI rises above 60, I will
consider fading the position and retaking a position in LABU. thus toggling positions in the
inverse ETFs as analysis and indicators dictate.

LABU Stock Chart Fibonacci Analysis 091223 Trading Idea
1) Find a FIBO slingshot
2) Check FIBO 61.80% level
3) Entry Point > 5.0/61.80%
Chart time frame : B
A) 15 min(1W-3M)
B) 1 hr(3M-6M)
C) 4 hr(6M-1year)
D) 1 day(1-3years)
Stock progress : B
A) Keep rising over 61.80% resistance
B) 61.80% resistance
C) Hit the bottom
D) Hit the top
Stocks rise as they rise from support and fall from resistance. Our goal is to find a low support point and enter. It can be referred to as buying at the pullback point. The pullback point can be found with a Fibonacci extension of 61.80%. This is a step to find entry level. 1) Find a triangle (Fibonacci Speed Fan Line) that connects the high (resistance) and low (support) points of the stock in progress, where it is continuously expressed as a Slingshot, 2) and create a Fibonacci extension level for the first rising wave from the start point of slingshot pattern.
When the current price goes over 61.80% level , that can be a good entry point, especially if the SMA 100 and 200 curves are gathered together at 61.80%, it is a very good entry point.
As a great help, tradingview provide these Fibonacci speed fan lines and extension levels with ease. So if you use the Fibonacci fan line, the extension level, and the SMA 100/200 curve well, you can find an entry point for the stock market. At least you have to enter at this low point to avoid trading failure, and if you are skilled at entering this low point, with fibonacci6180 technique, your reading skill to chart will be greatly improved.
If you want to do day trading, please set the time frame to 5 minutes or 15 minutes, and you will see many of the low point of rising stocks.
If want to prefer long term range trading, you can set the time frame to 1 hr or 1 day.

LABU 3X leveraged Medical Technology LONGLABU over the past ten trading days has trended down from the top of the volume profile
to near the bottom. The Price-volume trend is flat showing accumulation/coiling.
The price momentum oscillator shows an uptrend suggestive of bullish divergence and
the volumes are stable at or above the running mean. I see this as a good long trade
as some if the ETF components are pumping through earnings. If you are interested
to know my thoughts on a call option setup, please leave a comment.

LABU Parabolic returnWhat seems to be similar to a skewed shoulder-head-shoulder might go back to lower levels of 4.6.
Descending highs and lows.

raising price target to 9.50looking for price action to close above D leg of the previous ABCD pattern, and the 3rd Elliot wave. Also looking for these to act as future support levels for any retrace.

LABU is about to rally hard before a massive crashLABU is gearing up for a massive rally before it dumps. I have seen this chart pattern alot and I am looking forward to see how it plays out.
Not investment advice, please do your DD.

LABU Stock Chart Fibonacci Analysis 070623 Trading Idea
1) Find a FIBO slingshot
2) Check FIBO 61.80% level
3) Entry Point > 5.6/61.80%
Chart time frame : B
A) 15 min(1W-3M)
B) 1 hr(3M-6M)
C) 4 hr(6M-1year)
D) 1 day(1-3years)
Stock progress : B
A) Keep rising over 61.80% resistance
B) 61.80% resistance
C) Hit the bottom
D) Hit the top
Stocks rise as they rise from support and fall from resistance. Our goal is to find a low support point and enter. It can be referred to as buying at the pullback point. The pullback point can be found with a Fibonacci extension of 61.80%. This is a step to find entry level. 1) Find a triangle (Fibonacci Speed Fan Line) that connects the high (resistance) and low (support) points of the stock in progress, where it is continuously expressed as a Slingshot, 2) and create a Fibonacci extension level for the first rising wave from the start point of slingshot pattern.
When the current price goes over 61.80% level , that can be a good entry point, especially if the SMA 100 and 200 curves are gathered together at 61.80%, it is a very good entry point.
As a great help, tradingview provide these Fibonacci speed fan lines and extension levels with ease. So if you use the Fibonacci fan line, the extension level, and the SMA 100/200 curve well, you can find an entry point for the stock market. At least you have to enter at this low point to avoid trading failure, and if you are skilled at entering this low point, with fibonacci6180 technique, your reading skill to chart will be greatly improved.
If you want to do day trading, please set the time frame to 5 minutes or 15 minutes, and you will see many of the low point of rising stocks.
If want to prefer long term range trading, you can set the time frame to 1 hr or 1 day.

a punished sector is going to reboundAMEX:LABU is about to take off, one of the sectors most affected by the reduction in earnings due to the decline in medicine sales during the pandemic. However, it shows signs of stabilization, at least a 17% and a 35% in the foreseeable future with two falling wedges. Remember cyclicals in a overload market.

LABU scenario
labu break down importnat midpoint
if midpoint is broken i expec to prz y
prz y is be good apportunity to buy zone
market can change anydirection
preplan long short scenairo and stop loss
good luck to u .,.

LABU Stock Chart Fibonacci Analysis 051823 Trading Idea
1) Find a FIBO slingshot
2) Check FIBO 61.80% level
3) Entry Point > 6.42/61.80%
