Key stats
About Listed Funds Trust TrueShares Technology, AI & Deep Learning ETF
Home page
Inception date
Feb 28, 2020
Structure
Open-Ended Fund
Replication method
Physical
Dividend treatment
Distributes
Distribution tax treatment
Qualified dividends
Income tax type
Capital Gains
Max ST capital gains rate
39.60%
Max LT capital gains rate
20.00%
Primary advisor
Truemark Investments LLC
Distributor
Paralel Distributors LLC
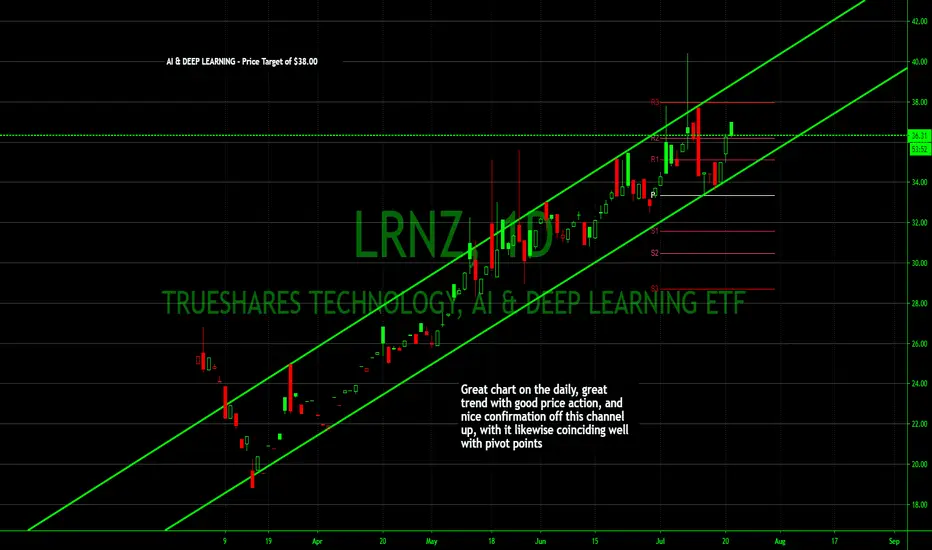
LRNZ is an actively managed, concentrated portfolio of global stocks focused on the development and utilization of artificial intelligence, machine learning, or other deep learning technologies. The fund holds 20-30 mostly large-cap stocks that derive at least half their revenue or are determined to have a competitive advantage, in such technologies. Stocks are classified as secular growth, a cyclical growth business, or IPO. The fund advisor selects the portfolio based on individual value and growth prospects. Secular growth stocks are expected to have the greatest number of holdings, which the advisor anticipates utilizing a buy-and-hold strategy. Cyclical growth businesses are screened using fundamental analysis, to potentially buy shares at the bottom of a cycle and sell at the peak. Positions in selected IPOs are built over four to six months following the IPO. LRNZ caps industry exposure at 25%. Prior to May 18, 2020, the fund name was TrueMark Technology, AI & Deep Learning.
Related funds
Classification
What's in the fund
Exposure type
Technology Services
Electronic Technology
Health Technology
Stock breakdown by region
Top 10 holdings

Summarizing what the indicators are suggesting.
Oscillators
Neutral
SellBuy
Strong sellStrong buy
Strong sellSellNeutralBuyStrong buy
Oscillators
Neutral
SellBuy
Strong sellStrong buy
Strong sellSellNeutralBuyStrong buy
Summary
Neutral
SellBuy
Strong sellStrong buy
Strong sellSellNeutralBuyStrong buy
Summary
Neutral
SellBuy
Strong sellStrong buy
Strong sellSellNeutralBuyStrong buy
Summary
Neutral
SellBuy
Strong sellStrong buy
Strong sellSellNeutralBuyStrong buy
Moving Averages
Neutral
SellBuy
Strong sellStrong buy
Strong sellSellNeutralBuyStrong buy
Moving Averages
Neutral
SellBuy
Strong sellStrong buy
Strong sellSellNeutralBuyStrong buy
Displays a symbol's price movements over previous years to identify recurring trends.
Frequently Asked Questions
An exchange-traded fund (ETF) is a collection of assets (stocks, bonds, commodities, etc.) that track an underlying index and can be bought on an exchange like individual stocks.
LRNZ trades at 43.66 USD today, its price has fallen −1.72% in the past 24 hours. Track more dynamics on LRNZ price chart.
LRNZ net asset value is 43.15 today — it's fallen 0.96% over the past month. NAV represents the total value of the fund's assets less liabilities and serves as a gauge of the fund's performance.
LRNZ assets under management is 34.67 M USD. AUM is an important metric as it reflects the fund's size and can serve as a gauge of how successful the fund is in attracting investors, which, in its turn, can influence decision-making.
LRNZ price has fallen by 0.00% over the last month, and its yearly performance shows a 18.37% increase. See more dynamics on LRNZ price chart.
NAV returns, another gauge of an ETF dynamics, have risen by −0.96% over the last month, have fallen by −0.96% over the last month, showed a 14.16% increase in three-month performance and has increased by 17.03% in a year.
NAV returns, another gauge of an ETF dynamics, have risen by −0.96% over the last month, have fallen by −0.96% over the last month, showed a 14.16% increase in three-month performance and has increased by 17.03% in a year.
LRNZ fund flows account for −8.02 M USD (1 year). Many traders use this metric to get insight into investors' sentiment and evaluate whether it's time to buy or sell the fund.
Since ETFs work like an individual stock, they can be bought and sold on exchanges (e.g. NASDAQ, NYSE, EURONEXT). As it happens with stocks, you need to select a brokerage to access trading. Explore our list of available brokers to find the one to help execute your strategies. Don't forget to do your research before getting to trading. Explore ETFs metrics in our ETF screener to find a reliable opportunity.
LRNZ invests in stocks. See more details in our Analysis section.
LRNZ expense ratio is 0.69%. It's an important metric for helping traders understand the fund's operating costs relative to assets and how expensive it would be to hold the fund.
No, LRNZ isn't leveraged, meaning it doesn't use borrowings or financial derivatives to magnify the performance of the underlying assets or index it follows.
In some ways, ETFs are safe investments, but in a broader sense, they're not safer than any other asset, so it's crucial to analyze a fund before investing. But if your research gives a vague answer, you can always refer to technical analysis.
Today, LRNZ technical analysis shows the sell rating and its 1-week rating is buy. Since market conditions are prone to changes, it's worth looking a bit further into the future — according to the 1-month rating LRNZ shows the buy signal. See more of LRNZ technicals for a more comprehensive analysis.
Today, LRNZ technical analysis shows the sell rating and its 1-week rating is buy. Since market conditions are prone to changes, it's worth looking a bit further into the future — according to the 1-month rating LRNZ shows the buy signal. See more of LRNZ technicals for a more comprehensive analysis.
LRNZ trades at a premium (1.19%).
Premium/discount to NAV expresses the difference between the ETF’s price and its NAV value. A positive percentage indicates a premium, meaning the ETF trades at a higher price than the calculated NAV. Conversely, a negative percentage indicates a discount, suggesting the ETF trades at a lower price than NAV.
Premium/discount to NAV expresses the difference between the ETF’s price and its NAV value. A positive percentage indicates a premium, meaning the ETF trades at a higher price than the calculated NAV. Conversely, a negative percentage indicates a discount, suggesting the ETF trades at a lower price than NAV.
LRNZ shares are issued by Truemark Group LLC
LRNZ follows the No Underlying Index. ETFs usually track some benchmark seeking to replicate its performance and guide asset selection and objectives.
The fund started trading on Feb 28, 2020.
The fund's management style is active, aiming to outperform its benchmark index by actively selecting and adjusting assets. The goal is to achieve returns that exceed those of the index the fund tracks.