$MJ Gartley My friend mentioned i shared this private last night, had no idea. Still decent RR, @TradingView should make lock on private red & bigger, easier to distinguish you are on not on public
MJ trade ideas


Gap TheoryThe gap theory is short and simple. Not everything needs to be lengthy and laborious. "Everything should be simple as possible, but not any simpler"
Break-Away Gap
Once a new cycle has begun and you see a breakaway gap in the STARTING of a move, you get confirmation of this new cycle. HOLD.
Run-Away Gap
Once the trend is continuing for some time and then you see a second gap, this is a confirmation that you are somewhere in the MIDDLE of the move, so you know a further movement in price is expected. HOLD.
There is a possibility that you can get multiple runaway gaps.
Exhaustion Gap
After a move in price had already happened, a gap that signals the END of the move happens. If this is your 3rd gap on the, you should look very closely to distinguish if it is a runaway gap or exhaustion gap. SELL.
How do you tell the difference between the exhaustion gap and the runaway gap?
Easy, if after the gap happens the price shoot straight up without closing the gap in the next few days ---> runaway gap. HOLD.
if after the gap happens the price is closing the gap in the next few days ---> exhaustion gap. SELL.
If you like it, follow and like so it will be saved in your saved ideas for future reference.

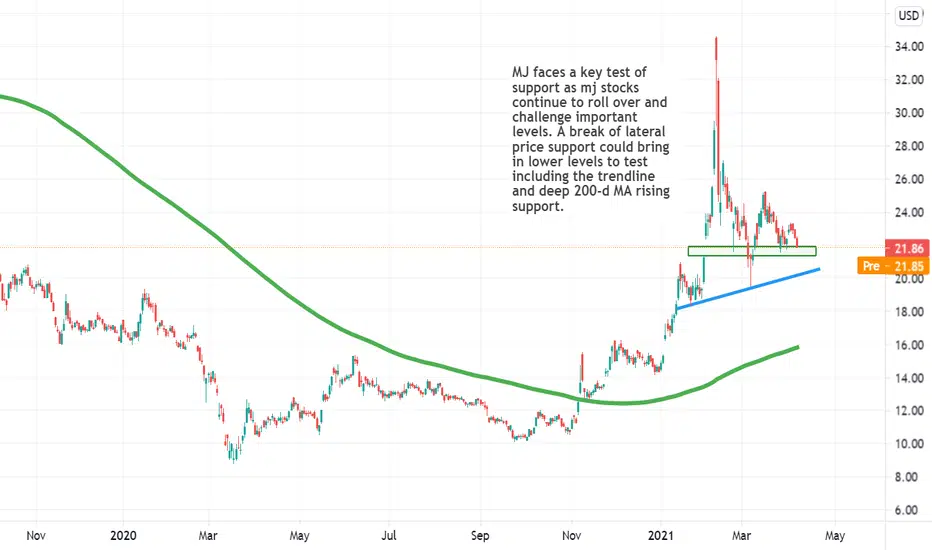
MJ is Where the Rubber the Meets the RoadMJ faces a key test of support as mj stocks continue to roll over and challenge important levels.
A break of lateral price support could bring in lower levels to test including the trendline and deep 200-d MA rising support.
Closing (IRA): MJ April 16th 18 Short Put... for .09/contract.
In for .63, (See Post Below), out for .09. .54 ($54) profit per contract. Still have May 21st 18s on.

Opening (IRA): MJ May 21st 18 Short Put... for a .48/contract credit.
Notes: High 30-day at 64.9%. Selling the 15 delta strike here. 2.74% ROC at max as a function of notional risk. Will take profit on approaching worthless or, if in the money, take assignment and sell call against.

The Week Ahead: MJ, ICLN, LIT, QQQOptions Highly Liquid Exchange-Traded Funds Ranked by 30-Day Implied Volatility:
MJ (39/75) (Cannabis)
ICLN (10/56) (Clean Energy)
LIT (36/47) (Battery)
JETS (2/46) (Airlines)
EWZ (5/43) (Brazil)
XBI (29/43) (Biotech)
XLE (8/42) (Energy)
SMH (28/41) (Semiconductor)
KRE (8/40) (Regional Banks)
SLV (10/38) (Silver)
Broad Market Exchange-Traded Funds Ranked by 30-Day Implied Volatility:
QQQ (13/30) (Nasdaq)
IWM (6/30) (Russell 2000)
SPY (3/20) (S&P 500)
DIA (1/19) (Dow Jones)
EFA (3/16) (MSCI ex. Canada/U.S.)
There isn't a May 7th weekly yet for my standard 45 day 16 delta short put, but will look at putting that on once it becomes available. Naturally, the implied volatility picture may have changed at that point; small caps have had the most implied volatility for several weeks running.
Bond Funds:
TLT (21/22) (20 Year+ Treasuries) (Yield 1.66%)
EMB (11/14) (Emerging Market) (Yield 3.97%)
HYG (12/12) (High Yield Corporate/Junk) (Yield 4.79%)
AGG (37/11) (U.S. Aggregate) (Yield 2.13%)
The Pictured Trade:
Featured here is an MJ May 21st (61 Days) 19 short put set up at the 18 delta strike in the May monthly. Paying .80 at the mid price as of Friday close, it has an 18.20 break even and a 4.40% return on capital at max as a function of notional risk. Naturally, it's a little bit long-dated if you like to try to keep things in that 45 until expiry or shorter wheelhouse. I don't have a ton on in May yet, so may do a smidge here, do a smidge next week, etc., so that I disperse risk over duration, rather than going all in everything at the top of the list with 45 days to go.
An alternative defined risk play is the 14/19 5-wide short put vertical, paying .70 as of Friday close on buying power of 4.30 -- a 16.3% return on capital at max as a function of buying power.

Bullish on weed this yearBullish longterm outlook on the overall weed industry with this Biden Admin

The Week Ahead: MJ, SRNE, INO, NKLA, XOP, ICLN, IWM PremiumLooking for the juice? Here's where it's at ... .
Options Highly Liquid Single Name >$10/Share With Earnings in the Rear View, Sorted By 30-Day with a >50% Cut-Off:
CRON (43/236) (Cannabis)
AMC (21/218) (Theatres)
TLRY (40/185) (Cannabis)
SRNE (5/165) (Biotech)
INO (4/145) (Biotech)
ACB (11/127) (Cannabis)
NKLA (12/125) (EV)
CGC (23/99) (Cannabis)
NCLH (4/99) (Cruise Lines)
NIO (34/97) (ADR; EV)
M (5/80) (Retail)
IQ (13/75) (ADR; Internet)
RCL (2/72) (Cruise Lines)
DKNG (5/69) (Online Gambling)
CLDR (6/64) (Software)
JD (28/61) (ADR; Internet Retail)
DDOG (19/61) (Software)
GPS (10/54) (Apparel)
AEO (1/52) (Apparel)
Options Highly Liquid Exchange-Traded Funds, Sorted By 30-Day, With a >35% Cut-Off:
MJ (47/80) (Cannabis)
XOP (6/57) (Oil and Gas)
ICLN (10/54) (Clean Energy)
LIT (40/52) (Battery Tech)
JETS (1/46) (Airlines)
EWU (3/46) (United Kingdom)
XBI (20/44) (Biotech)
EWZ (3/43) (Brazil)
XLE (6/41) (Energy)
GDX (3/39) (Gold Miners)
KRE (6/38) (Regional Banks)
SLV (8/38) (Silver)
XLK (7/36) (Technology)
Broad Market, Sorted by 30-Day:
IWM (7/31)
QQQ (10/31)
SPY (3/20)
DIA (0/20)
EFA (2/15)
The Pictured Trade:
Depicted here is an MJ July 16th (124 DTE) 17 short put, which was paying 1.11 at the mid price as of Friday close, 6.99% ROC at max as a function of notional risk (20.6% annualized). This is quite a bit more long-dated than I like to go generally, so I'll probably wait for a May monthly to open up (probably next week after the March monthly drops off) before considering doing anything. Similarly, neither ICLN, LIT, nor JETS have May monthlies yet and April will have a gotten a bit short in duration (currently 33 DTE) for those like me who prefer to work with a 45 day or less wheel house.

$MJ MaryJane will take a crack 40. $APHA $SNDLMajor TL break and consolidation. Big inflow of Monee on Thursday. Round 2 awaits.

Objective long entry for MJ As MJ has corrected 42% from the recent high, it offers an objective long entry as it is bouncing on triple support: down trend line since September 2018, horizontal support, and recent up trend line since November 2020.

MJ looking bullish. Daily chart on MJ is looking bullish. RSI is heading up and the MACD looks to be closing red and hopefully turn green. Looking at the candle sticks it looks like we could be bouncing off the 50 sma line and head up from there. Wouldnt be surprise to see previous highs or even reach new highs sometime this week depending on the market.

great chart request!similar chart to previous one, im guessing these are in the same sector. also bounced off previous support and trying to rally. top trendline is keeping it down for now. will eventually break though! be patient :)


The Week Ahead: MJ, LIT, ICLN, IWM/RUT, TNXOptions Highly Liquid Single Name With Earnings in the Rear View Mirror, Ranked by Percentage the April 16th At-the-Money Short Straddle is Paying as a Function of Stock Price:
AMC (24/221/50.6) (Movie Theatre)
TLRY (26/162/44.7) (Cannabis)
ACB (3/120/33.9) (Cannabis)
NKLA (12/128/30.9) (EV)
PLUG (44/114/30.7) (EV, Hydrogen)
SPCE (22/106/28.9) (Space Tourism)
CRON (47/104/28.3) (Cannabis)
CGC (20/97/24.1) (Cannabis)
M (18/95/21) (Department Store)
PBR (16/117/18.7) (Petro)
Options Highly Liquid Exchange-Traded Funds, Ranked by Percentage the April 16th At-the-Money Short Straddle is Paying as a Function of Stock Price:
MJ (40/76/22.1) (Cannabis)
LIT (46/57/15.5) (Lithium and Battery Tech)
ICLN (9/53/14.5) (Global Clean Energy Index)
EWZ (16/54/13.6) (Brazil)
JETS (2/48/13.3) (Global Jets)
SLV (30/49/12.4) (Silver)
XRT (22/56/11.6) (Retail)
XBI (24/41/11.2) (Biotech)
XLE (9/49/11.2) (Energy)
KRE (14/69/10.9( (Regional Banking)
Broad Market, Ranked by Percentage the April 16th At-the-Money Short Straddle is Paying as a Function of Stock Price:
IWM (18/36/9.5) (Russell 2000)
QQQ (17/33/8.7) (Nasdaq)
SPY (14/26/6.4) (S&P 500)
DIA (7/24/6.1) (Dow Jones)
EFA (18/19/5.7) (Global, ex. Canada/U.S.)
Bond Funds, Ranked by Percentage the April 16th At-the-Money Short Straddle is Paying as a Function of Stock Price:
TLT (23/27/4.9) (20+ Maturity Treasuries) (1.63% Yield)
EMB (12/18/2.9) (Emerging Market Bonds) (3.99% Yield)
HYG (17/15/2.8) (High Yield Corporate/Junk) (4.82% Yield)
AGG (19/9/2.2) (U.S. Aggregate Bonds) (2.15% Yield)
Comments:
For a number of weeks running, implied remains high in the cannabis sector, with TLRY, ACB, CRON, and CGC at the top of the single name list, and MJ at the top of the ETF list. Pictured here is a plain Jane MJ April 16th 16 delta short put, which paid .63/contract as of Friday close, a potential 3.63% ROC at max, 28.2% annualized at max as a function of notional risk.
Lithium and battery tech follows with the April (47 days) at-the-money short straddle paying greater than 15% and the April 15th 16 delta 51 short put paying 1.18 at the mid as of Friday close, a potential 2.37% ROC at max as a function of notional risk (18.4% annualized).
The ICLN April 16th 17 delta 22 short put paid .47 as of Friday close -- 2.18% ROC at max as a function of notional risk (16.9% annualized).
On the broad market front, IWM 30-day implied finished the week at >35%, followed by QQQ action at just a nibble under that mark at 33. The IWM April 16th 16 delta at the 189 was paying 3.05 (1.64% at max); the QQQ April 16th 16 at the 275, 4.15 (1.53% at max).
An honorable mention goes out to the T-bill and TLT shorters (who knew that trading T bills could be fun?) who shorted TLT or /ZN at pandemic highs, only to see yields on the ten-year T's move from .50 to 1.5 (and TLT from the 170's to finish Friday's session at 143 and change.

MJ about to get highGeneral Explanation of MJ
MJ is the first cannabis-focused ETF to trade in the US. The fund tracks an index of stocks across the globe that are engaged in the legal cultivation, production, marketing, or distribution of cannabis products for either medical or nonmedical purposes. The index identifies companies that legally derive more than half their revenue from cannabis-related activities. MJ also holds stocks of companies that trade or produce tobacco products, fertilizers, plant foods, pesticides, equipment for cannabis or tobacco. The fund initially did not include US companies due to its prohibition at the federal level but changed after new legislation. The index is reconstituted and rebalanced quarterly. Prior to Dec. 26, 2017, the fund was called the Tierra XP Latin America Real Estate ETF and tracked an index focused on Latin America real estate companies with the ticker LARE. Before Feb. 9, 2018, the fund traded under the ticker MJX.
Technical Perspective:
-We can see that the bearish trend From September 2018 - March 2020 has been broken. The price found its bottom on 8.67
-After breaking the descending trendline, we had a strong bullish movement towards 34.50 and, after that, a 36% correction to current levels
-We can see that we have a huge support zone between 23 and 25. If the price stays above that level, we can take it as a good signal of buyers in the zone which eventually can push the price higher.
-We consider that if the price reaches 27.5, that will be a confirmation of the bullish trend, and we expect to see a movement towards the next resistance zone at 39 - 40
-We should pay attention to 32.5 as an inner resistance zone that the price has to break before reaching our Target; that would be a smart place to protect positions.
As a final curiosity, we will leave here the current 10 top holdings of this ETF / % of each stock / ticker / shares held / Market Value USD
APHRIA INC 10.32% APHA 9,686,494 $194,407,934.58
GW PHARM-ADR 9.64% GWPH 844,511 $181,569,865.00
TILRAY INC-CL 2 7.48% TLRY 5,033,560 $140,839,008.80
CANOPY GROWTH CO 5.86% CGC 3,099,126 $110,328,885.60
GROWGENERATION CORP 5.50% GRWG 2,044,958 $103,515,773.96
CRONOS GROUP INC 5.42% CRON 8,944,741 $102,059,494.81
HEXO CORP 3.98% HEXO 9,655,518 $75,023,374.86
VILLAGE FARMS IN 3.90% VFF 4,469,612 $73,525,117.40
SCHWEITZER-MAUDU 3.66% SWM 1,446,363 $68,991,515.10
VECTOR GROUP LTD 3.54% VGR 4,639,762 $66,719,777.56


Opening (IRA): MJ April 19th 18 Short Put... for a .63/contract credit.
Notes: The ETF with the highest 30-day on my board at 75.9%. 3.63% ROC at max.

MJ potential for bullish move off lowsI have a position in some individual names, but am using the ETF as an indicator of the overall sector. Looking bullish coming off the lows put in earlier in last week, potential 1-2 start of the lows. Target is the previous high, but if we clear the previous high, potential to continue rally.
Also just considering the amount of volume and interest in the overall sector, both by WSB and traditional traders, this definitely has potential.
Disclaimer: The proceeding content is informational only and based on information available when created. It is not an offer or a solicitation nor is it tax or legal advice. It does not consider your financial circumstances and objectives and may not be suitable for you.
Copyright Rohan Karunaratne 2021

Is MJ getting ready to break $24? Too early to tell, but it looks as though MJ is bouncing off a $24 resistance level while also developing a bearish divergence in the RSI and MACD. If MJ stays within the drawn channels, I could see it selling off a bit and testing the lower channel/MA to form an ascending triangle. This should also create the opportunity to bounce off the RSI support and make way towards the $24 level again. I believe MJ has a positive long term outlook, so I would most likely be a buyer of a $24 break or a $22 retest of the lower channel...interested to see where it goes from here.

MJ looks ready to launch?? READY to break out the base, nice flag in making. Consolidating above EMA 200 (first time since May 19), retested & reversed - Once break out first target $20

Weeds to the moon!Hello!
It appears we are in this area of the chart; if it were projected forward onto today. Ill be excited to see how this play out!
Good luck!
