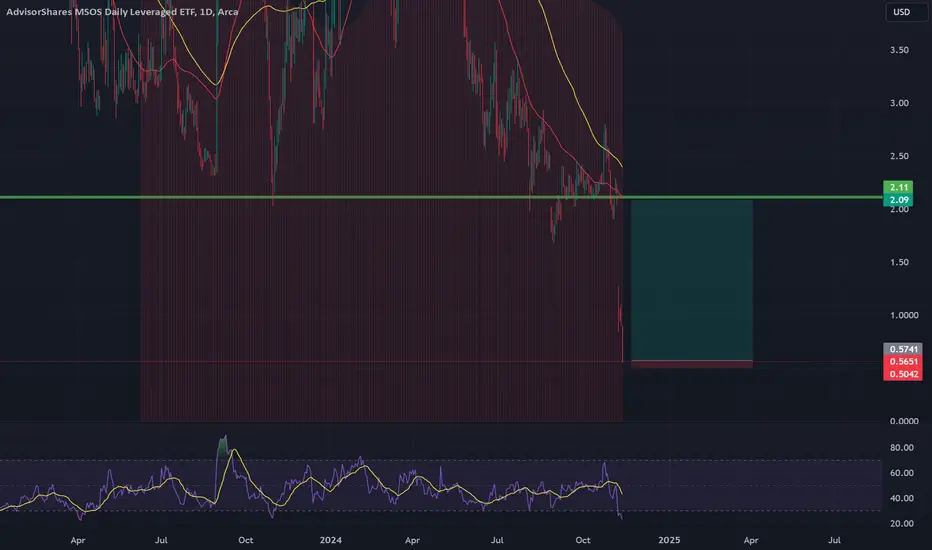
MSOX dead or oversold ?down 40% yesterday big weed selloff could make for a nice turnaround i personally do not see trump being anti weed
Key stats
About AdvisorShares MSOS Daily Leveraged ETF
Home page
Inception date
Aug 24, 2022
Structure
Open-Ended Fund
Replication method
Synthetic
Dividend treatment
Distributes
Distribution tax treatment
Ordinary income
Income tax type
Capital Gains
Max ST capital gains rate
39.60%
Max LT capital gains rate
20.00%
Primary advisor
AdvisorShares Investments LLC
Distributor
Foreside Fund Services LLC
MSOX provides 2x leveraged exposure to the daily performance of MSOS, an affiliated exchange-traded fund that concentrates on mid- and small-cap US companies engaged in the cannabis and hemp industries. In addition to stocks, the underlying fund also uses total return swap contracts to gain such exposure. MSOX will enter into one or more swap agreements intended to produce leveraged investment results relative to the returns of MSOS. To achieve maximum results, the fund may also hold money market instruments or other cash equivalents as collateral. As a geared product with daily resets, MSOX is designed as a short-term trading tool and not a long-term investment vehicle. Long-term returns could materially differ from those of the underlying fund due to daily compounding. Investors also need to be aware of the ongoing regulatory risks on cannabis. Prior to Nov. 1, 2024 the fund name was MSOS 2x Daily ETF.
Related funds
Classification
What's in the fund
Exposure type
Miscellaneous
Bonds, Cash & Other100.00%
Miscellaneous245.25%
Cash5.72%
Mutual fund−150.97%
Top 10 holdings
$MSOX 70% Upside 2024Chart speaks for itself. Marijuana rescheduling (from 1 to 3) is all but set in stone. DEA sources have confirmed as of today 3/15 which triggered a wave of upticks in US Cannabis stocks all traded on the OTC except the ETF AMEX:MSOS and $MSOX. DEA rescheduling would allow US Cannabis stocks to up

MSOX - Gorgeous flag
It's hard not to get excited by that daily flag. Next target is clearly 5.
I would like it to test 6 around the 200 EMA and flag there on its way to 11.
Long via commons at 3.55 with B/E stop loss

See all ideas
Summarizing what the indicators are suggesting.
Oscillators
Neutral
SellBuy
Strong sellStrong buy
Strong sellSellNeutralBuyStrong buy
Oscillators
Neutral
SellBuy
Strong sellStrong buy
Strong sellSellNeutralBuyStrong buy
Summary
Neutral
SellBuy
Strong sellStrong buy
Strong sellSellNeutralBuyStrong buy
Summary
Neutral
SellBuy
Strong sellStrong buy
Strong sellSellNeutralBuyStrong buy
Summary
Neutral
SellBuy
Strong sellStrong buy
Strong sellSellNeutralBuyStrong buy
Moving Averages
Neutral
SellBuy
Strong sellStrong buy
Strong sellSellNeutralBuyStrong buy
Moving Averages
Neutral
SellBuy
Strong sellStrong buy
Strong sellSellNeutralBuyStrong buy
Displays a symbol's price movements over previous years to identify recurring trends.
Frequently Asked Questions
An exchange-traded fund (ETF) is a collection of assets (stocks, bonds, commodities, etc.) that track an underlying index and can be bought on an exchange like individual stocks.
MSOX trades at 4.20 USD today, its price has risen 17.16% in the past 24 hours. Track more dynamics on MSOX price chart.
MSOX net asset value is 4.21 today — it's risen 64.68% over the past month. NAV represents the total value of the fund's assets less liabilities and serves as a gauge of the fund's performance.
MSOX assets under management is 15.80 M USD. AUM is an important metric as it reflects the fund's size and can serve as a gauge of how successful the fund is in attracting investors, which, in its turn, can influence decision-making.
MSOX price has risen by 83.41% over the last month, and its yearly performance shows a −92.66% decrease. See more dynamics on MSOX price chart.
NAV returns, another gauge of an ETF dynamics, showed a 0.26% increase in three-month performance and has decreased by −92.68% in a year.
NAV returns, another gauge of an ETF dynamics, showed a 0.26% increase in three-month performance and has decreased by −92.68% in a year.
MSOX fund flows account for 34.42 M USD (1 year). Many traders use this metric to get insight into investors' sentiment and evaluate whether it's time to buy or sell the fund.
Since ETFs work like an individual stock, they can be bought and sold on exchanges (e.g. NASDAQ, NYSE, EURONEXT). As it happens with stocks, you need to select a brokerage to access trading. Explore our list of available brokers to find the one to help execute your strategies. Don't forget to do your research before getting to trading. Explore ETFs metrics in our ETF screener to find a reliable opportunity.
MSOX invests in cash. See more details in our Analysis section.
MSOX expense ratio is 0.97%. It's an important metric for helping traders understand the fund's operating costs relative to assets and how expensive it would be to hold the fund.
Yes, MSOX is a leveraged ETF, meaning it uses borrowings or financial derivatives to magnify the performance of the underlying assets or index it follows.
In some ways, ETFs are safe investments, but in a broader sense, they're not safer than any other asset, so it's crucial to analyze a fund before investing. But if your research gives a vague answer, you can always refer to technical analysis.
Today, MSOX technical analysis shows the buy rating and its 1-week rating is neutral. Since market conditions are prone to changes, it's worth looking a bit further into the future — according to the 1-month rating MSOX shows the sell signal. See more of MSOX technicals for a more comprehensive analysis.
Today, MSOX technical analysis shows the buy rating and its 1-week rating is neutral. Since market conditions are prone to changes, it's worth looking a bit further into the future — according to the 1-month rating MSOX shows the sell signal. See more of MSOX technicals for a more comprehensive analysis.
No, MSOX doesn't pay dividends to its holders.
MSOX trades at a premium (0.14%).
Premium/discount to NAV expresses the difference between the ETF’s price and its NAV value. A positive percentage indicates a premium, meaning the ETF trades at a higher price than the calculated NAV. Conversely, a negative percentage indicates a discount, suggesting the ETF trades at a lower price than NAV.
Premium/discount to NAV expresses the difference between the ETF’s price and its NAV value. A positive percentage indicates a premium, meaning the ETF trades at a higher price than the calculated NAV. Conversely, a negative percentage indicates a discount, suggesting the ETF trades at a lower price than NAV.
MSOX shares are issued by Wilson Lane Group LLC
MSOX follows the No Underlying Index. ETFs usually track some benchmark seeking to replicate its performance and guide asset selection and objectives.
The fund started trading on Aug 24, 2022.
The fund's management style is active, aiming to outperform its benchmark index by actively selecting and adjusting assets. The goal is to achieve returns that exceed those of the index the fund tracks.