PBW Clean EnergyBack to the lows
Will the sector be starting back up soon? Or base here for a few months to years then go?
Not financial advice
Key stats
About Invesco WilderHill Clean Energy ETF
Home page
Inception date
Mar 3, 2005
Structure
Open-Ended Fund
Replication method
Physical
Dividend treatment
Distributes
Distribution tax treatment
Qualified dividends
Income tax type
Capital Gains
Max ST capital gains rate
39.60%
Max LT capital gains rate
20.00%
Primary advisor
Invesco Capital Management LLC
Distributor
Invesco Distributors, Inc.
PBW is highly diverse in scope, reaching beyond just industry pure-plays like wind, solar, biofuels and geothermal companies, to include companies based on their perceived relevance to the renewable energy space. The fund's proprietary selection process and its mandate to hold only US-listed companies select companies that are perceived to benefit from the societal transition or advancement toward clean energy and conservation. Included as well are companies developing and selling energy technologies and energy management services to address efficiency and environmental issues, along with fossil fuel resource abundance concerns. PBW follows a tiered, equal-weighting structure and caps each holding at 4%. The index is reconstituted and rebalanced quarterly.
Related funds
Classification
What's in the fund
Exposure type
Producer Manufacturing
Electronic Technology
Process Industries
Stock breakdown by region
Top 10 holdings

Macro dashboard - Relative rotation graphsA modified version of Lux's Orbital graph that mimics Julius de Kempenaer's commercial trading tool, the Relative Rotation Graphs (RRG). Mods include:
Multiple time frame analysis: Default is the daily view, but has the option to go to lower (for quick day trades) or higher (for building long-te

Clean EnergyWith the recent focus on Europe and it's energy dependence on Russia I thought to highlight an ETF I think could work out on a longer timescale. The EU currently relies on Russia for about 40% of it's natural gas . With the recent war by Putin I think European countries will start 1) start rethinki

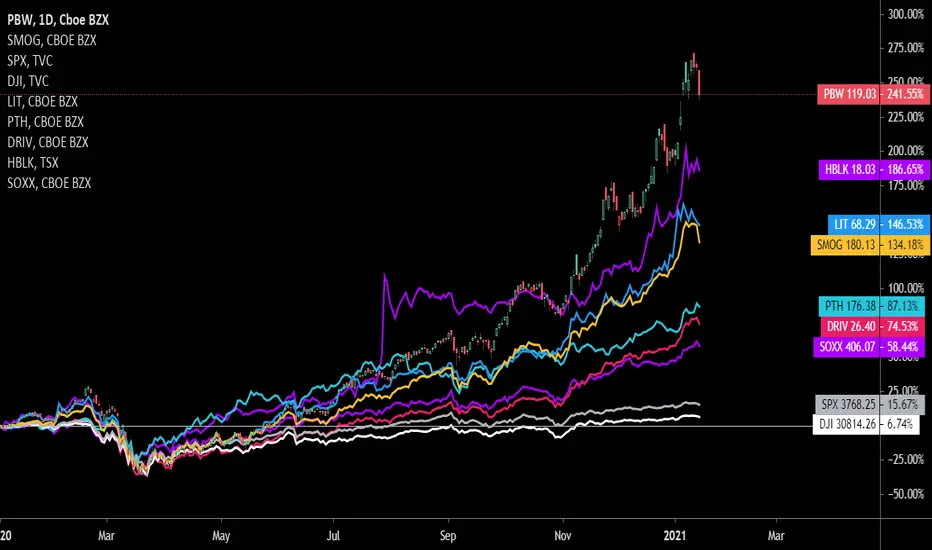
PBW outlookAs large institutions divest of conventional "non" green funds, that money will pour into the Green sector funds.


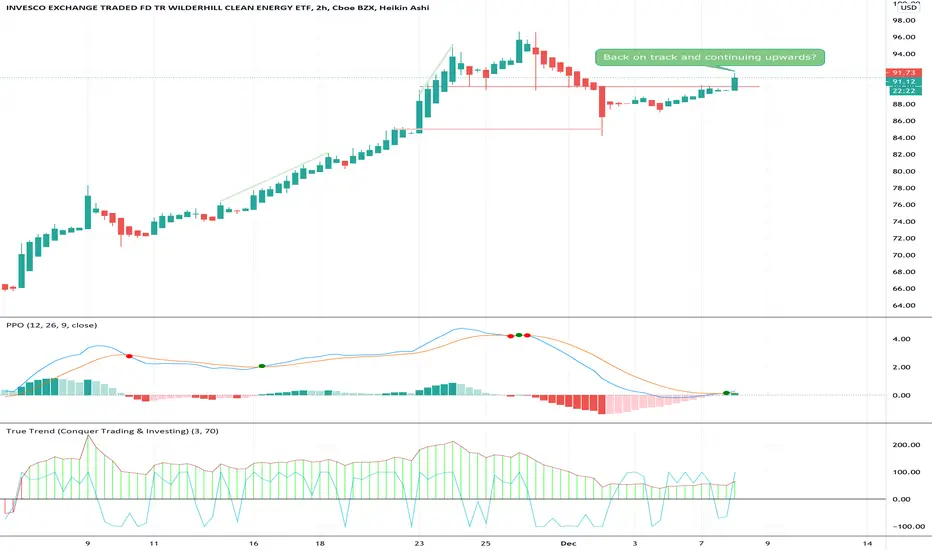
PBW Clean energy, Potential upside popMACD reaching levels that hasn't been touched since Feb/March lows. I see momentum taking us to newer highs, with a new trend higher into the rest of the year.


Time for PBW to resume its upward trend?PBW has been trading sideways after breaking down from its long upward trend (fueled by the prospect of clean energy stimulus in 2021).
See all ideas
Summarizing what the indicators are suggesting.
Oscillators
Neutral
SellBuy
Strong sellStrong buy
Strong sellSellNeutralBuyStrong buy
Oscillators
Neutral
SellBuy
Strong sellStrong buy
Strong sellSellNeutralBuyStrong buy
Summary
Neutral
SellBuy
Strong sellStrong buy
Strong sellSellNeutralBuyStrong buy
Summary
Neutral
SellBuy
Strong sellStrong buy
Strong sellSellNeutralBuyStrong buy
Summary
Neutral
SellBuy
Strong sellStrong buy
Strong sellSellNeutralBuyStrong buy
Moving Averages
Neutral
SellBuy
Strong sellStrong buy
Strong sellSellNeutralBuyStrong buy
Moving Averages
Neutral
SellBuy
Strong sellStrong buy
Strong sellSellNeutralBuyStrong buy
Displays a symbol's price movements over previous years to identify recurring trends.
Frequently Asked Questions
An exchange-traded fund (ETF) is a collection of assets (stocks, bonds, commodities, etc.) that track an underlying index and can be bought on an exchange like individual stocks.
PBW trades at 22.23 USD today, its price has fallen −2.37% in the past 24 hours. Track more dynamics on PBW price chart.
PBW net asset value is 22.21 today — it's risen 10.69% over the past month. NAV represents the total value of the fund's assets less liabilities and serves as a gauge of the fund's performance.
PBW assets under management is 310.05 M USD. AUM is an important metric as it reflects the fund's size and can serve as a gauge of how successful the fund is in attracting investors, which, in its turn, can influence decision-making.
PBW price has risen by 9.83% over the last month, and its yearly performance shows a 2.35% increase. See more dynamics on PBW price chart.
NAV returns, another gauge of an ETF dynamics, have risen by 10.69% over the last month, showed a 37.14% increase in three-month performance and has increased by 4.51% in a year.
NAV returns, another gauge of an ETF dynamics, have risen by 10.69% over the last month, showed a 37.14% increase in three-month performance and has increased by 4.51% in a year.
PBW fund flows account for −42.25 M USD (1 year). Many traders use this metric to get insight into investors' sentiment and evaluate whether it's time to buy or sell the fund.
Since ETFs work like an individual stock, they can be bought and sold on exchanges (e.g. NASDAQ, NYSE, EURONEXT). As it happens with stocks, you need to select a brokerage to access trading. Explore our list of available brokers to find the one to help execute your strategies. Don't forget to do your research before getting to trading. Explore ETFs metrics in our ETF screener to find a reliable opportunity.
PBW invests in stocks. See more details in our Analysis section.
PBW expense ratio is 0.65%. It's an important metric for helping traders understand the fund's operating costs relative to assets and how expensive it would be to hold the fund.
No, PBW isn't leveraged, meaning it doesn't use borrowings or financial derivatives to magnify the performance of the underlying assets or index it follows.
In some ways, ETFs are safe investments, but in a broader sense, they're not safer than any other asset, so it's crucial to analyze a fund before investing. But if your research gives a vague answer, you can always refer to technical analysis.
Today, PBW technical analysis shows the neutral rating and its 1-week rating is neutral. Since market conditions are prone to changes, it's worth looking a bit further into the future — according to the 1-month rating PBW shows the sell signal. See more of PBW technicals for a more comprehensive analysis.
Today, PBW technical analysis shows the neutral rating and its 1-week rating is neutral. Since market conditions are prone to changes, it's worth looking a bit further into the future — according to the 1-month rating PBW shows the sell signal. See more of PBW technicals for a more comprehensive analysis.
Yes, PBW pays dividends to its holders with the dividend yield of 1.43%.
PBW trades at a premium (0.07%).
Premium/discount to NAV expresses the difference between the ETF’s price and its NAV value. A positive percentage indicates a premium, meaning the ETF trades at a higher price than the calculated NAV. Conversely, a negative percentage indicates a discount, suggesting the ETF trades at a lower price than NAV.
Premium/discount to NAV expresses the difference between the ETF’s price and its NAV value. A positive percentage indicates a premium, meaning the ETF trades at a higher price than the calculated NAV. Conversely, a negative percentage indicates a discount, suggesting the ETF trades at a lower price than NAV.
PBW shares are issued by Invesco Ltd.
PBW follows the The WilderHill Clean Energy Index (AMEX). ETFs usually track some benchmark seeking to replicate its performance and guide asset selection and objectives.
The fund started trading on Mar 3, 2005.
The fund's management style is passive, meaning it's aiming to replicate the performance of the underlying index by holding assets in the same proportions as the index. The goal is to match the index's returns.