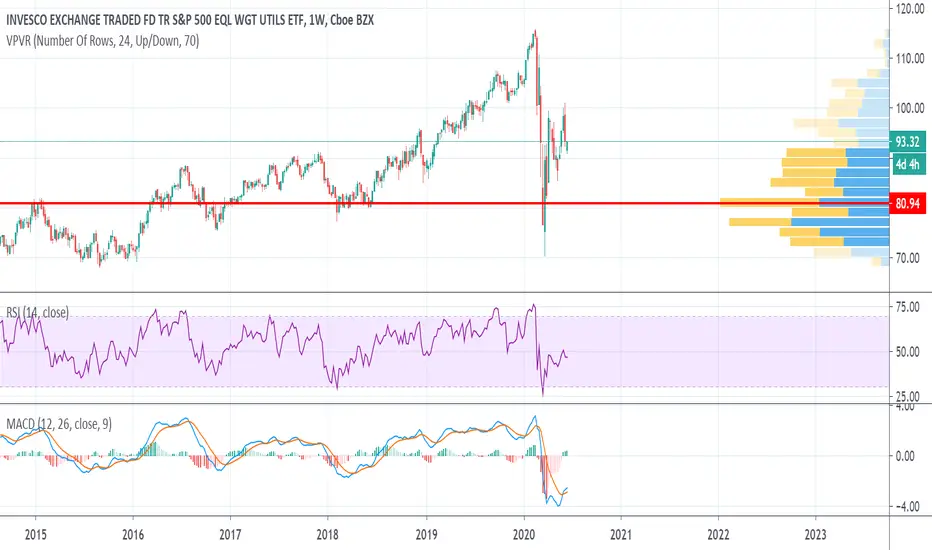
Major market bottoms equal weight utilities / equal weight S&PMajor market bottoms in 2009 and 2020 have bottomed at the following trend line for equal weight utilities against the equal weight s&p. If we continue to move down this will be one to watch for a major bottom for the equal weight S&P
Key stats
About Invesco S&P 500 Equal Weight Utilities ETF
Home page
Inception date
Nov 1, 2006
Structure
Open-Ended Fund
Replication method
Physical
Dividend treatment
Distributes
Distribution tax treatment
Qualified dividends
Income tax type
Capital Gains
Max ST capital gains rate
39.60%
Max LT capital gains rate
20.00%
Primary advisor
Invesco Capital Management LLC
Distributor
Invesco Distributors, Inc.
RSPU tracks an equal-weighted index of large-cap utilities companies. Its equal-weighting scheme skews it away from a market-like portfolio. The fund also includes a significant allocation to telecom stocks, which are not included in some utilities fund. This is common, however, as many utilities ETFs combine the two sectors and telecom stocks may pay higher dividends than utilities. Still, investors looking for pure-play exposure should look elsewhere. The index is rebalanced on a quarterly basis. Prior to June 07, 2023, the fund traded under the ticker, RYU.
Related funds
Classification
What's in the fund
Exposure type
Utilities
Stock breakdown by region
Top 10 holdings

Is it time for a utilities play?Defensives have been outperforming the S&P 500 since March. If you believe the outperformance will continue, then now might be the time to buy, as they are approaching the support line.
I'm particularly watching utilities. In addition to being a classic defensive sector, utilities also have "gro


Utilities could substantially outperform this yearUtilities traditionally are a recession safe haven, although in March they fell along with the broader market. There is reason, however, to think they will outperform going forward. According to an analyst poll conducted by FactSet, analysts expect utilities to be the sector least affected by the pa
RYU Longlooking at RYU where the SP is equally weighted the weekly does not look quite as dire. I suspect sideways action till the FED decision but it can still climb higher as it is consolidating now
Like · Reply · 2

Are utilities leadership?I would have never guessed utilities would be the best sector in the S&P 500 in a year when GDP is finally supposed to accelerate to above 3%. The market obviously isn't believing that.

See all ideas
Summarizing what the indicators are suggesting.
Oscillators
Neutral
SellBuy
Strong sellStrong buy
Strong sellSellNeutralBuyStrong buy
Oscillators
Neutral
SellBuy
Strong sellStrong buy
Strong sellSellNeutralBuyStrong buy
Summary
Neutral
SellBuy
Strong sellStrong buy
Strong sellSellNeutralBuyStrong buy
Summary
Neutral
SellBuy
Strong sellStrong buy
Strong sellSellNeutralBuyStrong buy
Summary
Neutral
SellBuy
Strong sellStrong buy
Strong sellSellNeutralBuyStrong buy
Moving Averages
Neutral
SellBuy
Strong sellStrong buy
Strong sellSellNeutralBuyStrong buy
Moving Averages
Neutral
SellBuy
Strong sellStrong buy
Strong sellSellNeutralBuyStrong buy
Displays a symbol's price movements over previous years to identify recurring trends.
Frequently Asked Questions
An exchange-traded fund (ETF) is a collection of assets (stocks, bonds, commodities, etc.) that track an underlying index and can be bought on an exchange like individual stocks.
RSPU trades at 73.02 USD today, its price has risen 1.50% in the past 24 hours. Track more dynamics on RSPU price chart.
RSPU net asset value is 73.03 today — it's risen 4.73% over the past month. NAV represents the total value of the fund's assets less liabilities and serves as a gauge of the fund's performance.
RSPU assets under management is 434.43 M USD. AUM is an important metric as it reflects the fund's size and can serve as a gauge of how successful the fund is in attracting investors, which, in its turn, can influence decision-making.
RSPU price has risen by 3.94% over the last month, and its yearly performance shows a 21.82% increase. See more dynamics on RSPU price chart.
NAV returns, another gauge of an ETF dynamics, have risen by 4.73% over the last month, showed a 7.14% increase in three-month performance and has increased by 25.08% in a year.
NAV returns, another gauge of an ETF dynamics, have risen by 4.73% over the last month, showed a 7.14% increase in three-month performance and has increased by 25.08% in a year.
RSPU fund flows account for 105.34 M USD (1 year). Many traders use this metric to get insight into investors' sentiment and evaluate whether it's time to buy or sell the fund.
Since ETFs work like an individual stock, they can be bought and sold on exchanges (e.g. NASDAQ, NYSE, EURONEXT). As it happens with stocks, you need to select a brokerage to access trading. Explore our list of available brokers to find the one to help execute your strategies. Don't forget to do your research before getting to trading. Explore ETFs metrics in our ETF screener to find a reliable opportunity.
RSPU invests in stocks. See more details in our Analysis section.
RSPU expense ratio is 0.40%. It's an important metric for helping traders understand the fund's operating costs relative to assets and how expensive it would be to hold the fund.
No, RSPU isn't leveraged, meaning it doesn't use borrowings or financial derivatives to magnify the performance of the underlying assets or index it follows.
In some ways, ETFs are safe investments, but in a broader sense, they're not safer than any other asset, so it's crucial to analyze a fund before investing. But if your research gives a vague answer, you can always refer to technical analysis.
Today, RSPU technical analysis shows the strong buy rating and its 1-week rating is strong buy. Since market conditions are prone to changes, it's worth looking a bit further into the future — according to the 1-month rating RSPU shows the strong buy signal. See more of RSPU technicals for a more comprehensive analysis.
Today, RSPU technical analysis shows the strong buy rating and its 1-week rating is strong buy. Since market conditions are prone to changes, it's worth looking a bit further into the future — according to the 1-month rating RSPU shows the strong buy signal. See more of RSPU technicals for a more comprehensive analysis.
Yes, RSPU pays dividends to its holders with the dividend yield of 2.50%.
RSPU trades at a premium (0.02%).
Premium/discount to NAV expresses the difference between the ETF’s price and its NAV value. A positive percentage indicates a premium, meaning the ETF trades at a higher price than the calculated NAV. Conversely, a negative percentage indicates a discount, suggesting the ETF trades at a lower price than NAV.
Premium/discount to NAV expresses the difference between the ETF’s price and its NAV value. A positive percentage indicates a premium, meaning the ETF trades at a higher price than the calculated NAV. Conversely, a negative percentage indicates a discount, suggesting the ETF trades at a lower price than NAV.
RSPU shares are issued by Invesco Ltd.
RSPU follows the S&P 500 Equal Weighted / Utilities Plus. ETFs usually track some benchmark seeking to replicate its performance and guide asset selection and objectives.
The fund started trading on Nov 1, 2006.
The fund's management style is passive, meaning it's aiming to replicate the performance of the underlying index by holding assets in the same proportions as the index. The goal is to match the index's returns.