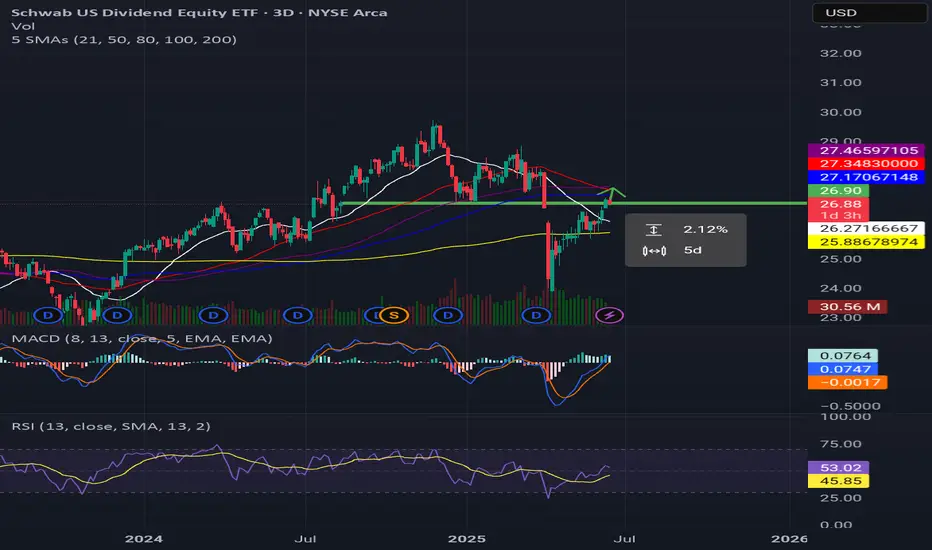
Schwab US Dividend Equity ETF pump incoming?You're looking at Schwab US Dividend Equity ETF, symbol SCHD, and have some clear price targets and potential scenarios in mind.
Based on the current information, SCHD's last price at 10:20:50 AM PDT on June 16, 2025, is **$26.875**.
Here's a breakdown of your analysis:
* **Key Resistance for Ups
Key stats
About Schwab US Dividend Equity ETF
Home page
Inception date
Oct 20, 2011
Structure
Open-Ended Fund
Replication method
Physical
Dividend treatment
Distributes
Distribution tax treatment
Qualified dividends
Income tax type
Capital Gains
Max ST capital gains rate
39.60%
Max LT capital gains rate
20.00%
Primary advisor
Charles Schwab Investment Management, Inc.
Distributor
SEI Investments Distribution Co.
SCHD is a market-cap-weighted fund whose selection universe only includes firms with a 10-year history of paying dividends. Within that universe, SCHD uses fundamental screens (cash-flow to debt ratio, ROE, dividend yield, and dividend growth rate) to build its portfolio. The objective is to focus on quality companies with sustainable dividends. As such, this approach gives the fund a modest large cap tilt and excludes REITs entirely. Individual securities are capped at 4% and sectors capped at 25% of the portfolio. Its overall composition is reviewed annually, while the portfolio is rebalanced quarterly.
Related funds
Classification
What's in the fund
Exposure type
Health Technology
Consumer Non-Durables
Energy Minerals
Electronic Technology
Stock breakdown by region
Top 10 holdings
Prediction line and reason for SCHD's long-term to medium-term First, when looking at all charts, let's consider them as a "Momi Ai" market... Even if the previous candles indicate a clear trend, consider that it might enter a Momi Ai phase in the future.
When you see someone talking about their current evaluation yield or realized yield, and you just think, "

The Dividend King: $SCHD🚀 All Hail SCHD - The Dividend Fan Favorite! 🔥
Ticker: Schwab U.S. Dividend Equity ETF ( AMEX:SCHD )
Timeframe: Daily Chart
Why You Can't Ignore SCHD:
SCHD is the GOAT of dividend ETFs. With its strong track record of outperforming, stable cash flows, and juicy dividend yield, this ETF is a must-

SCHD Long-Term Outlook - 40%+ in the Next 3 YearsTicker: SCHD (Schwab U.S. Dividend Equity ETF)
Timeframe: 1M (Monthly)
Analysis:
SCHD has consistently shown strong performance since its inception, benefiting from a diversified portfolio of dividend-paying stocks. The chart highlights a classic Elliott Wave structure:
Wave (1): Initial growth ph

SCHD , Bounce VS Continuing Momentum just a thought
SCHD facing a decent support area
and Fibonacci 0.5 , a bounce is expected
lets wait and see

Why SCHD Could Be a Quick Win for Savvy Scalpers Eyeing Upside
As always, we like to keep it clean and simple, with technicals and analysis that's easy to see and understand. Let's get into it:
The Schwab U.S. Dividend Equity ETF (SCHD) has recently experienced a downturn, but several factors suggest a near-term upward reversal:
Technical Indicators:
1. S

SCHD Getting Back on Track?Easily the best cash-flow dividend ETF, AMEX:SCHD seems to be in the process of getting back on its long-term track following the easy money excesses of the Fed's post-pandemic policies.
This forecast is a bullish scenario, imo, that might even accommodate a modest recession. The large-cap value

SCHD - more upsidehi traders
Let's take a look at SCHD weekly chart.
As we can see SCHD has been in a long-term downtrend.
Since January 2022 it's been in a mid-term correction which seems to be getting to the end.
The price broke above the downsloping resistance already.
If we get a follow-through, SCHD will make

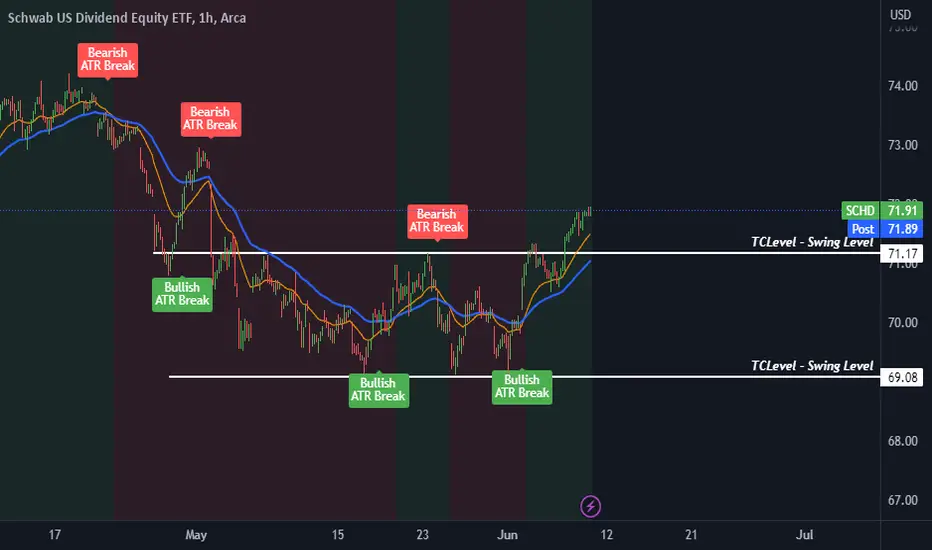
Bullish ComboFinally a good breakout of the channel with crossover and price action.
$72.45 - $73.7 are the next levels.
SCHD is coming sooooon bulll??
SCHG momentum is dying now.
but 200ma will be support in weekly time frame.
let's watch what happen in prz
^^

See all ideas
Summarizing what the indicators are suggesting.
Oscillators
Neutral
SellBuy
Strong sellStrong buy
Strong sellSellNeutralBuyStrong buy
Oscillators
Neutral
SellBuy
Strong sellStrong buy
Strong sellSellNeutralBuyStrong buy
Summary
Neutral
SellBuy
Strong sellStrong buy
Strong sellSellNeutralBuyStrong buy
Summary
Neutral
SellBuy
Strong sellStrong buy
Strong sellSellNeutralBuyStrong buy
Summary
Neutral
SellBuy
Strong sellStrong buy
Strong sellSellNeutralBuyStrong buy
Moving Averages
Neutral
SellBuy
Strong sellStrong buy
Strong sellSellNeutralBuyStrong buy
Moving Averages
Neutral
SellBuy
Strong sellStrong buy
Strong sellSellNeutralBuyStrong buy
Displays a symbol's price movements over previous years to identify recurring trends.
Frequently Asked Questions
An exchange-traded fund (ETF) is a collection of assets (stocks, bonds, commodities, etc.) that track an underlying index and can be bought on an exchange like individual stocks.
SCHD trades at 27.20 USD today, its price has fallen −0.33% in the past 24 hours. Track more dynamics on SCHD price chart.
SCHD net asset value is 27.20 today — it's risen 2.99% over the past month. NAV represents the total value of the fund's assets less liabilities and serves as a gauge of the fund's performance.
SCHD assets under management is 71.15 B USD. AUM is an important metric as it reflects the fund's size and can serve as a gauge of how successful the fund is in attracting investors, which, in its turn, can influence decision-making.
SCHD price has risen by 3.10% over the last month, and its yearly performance shows a −0.10% decrease. See more dynamics on SCHD price chart.
NAV returns, another gauge of an ETF dynamics, showed a 6.56% increase in three-month performance and has increased by 2.70% in a year.
NAV returns, another gauge of an ETF dynamics, showed a 6.56% increase in three-month performance and has increased by 2.70% in a year.
SCHD fund flows account for 13.40 B USD (1 year). Many traders use this metric to get insight into investors' sentiment and evaluate whether it's time to buy or sell the fund.
Since ETFs work like an individual stock, they can be bought and sold on exchanges (e.g. NASDAQ, NYSE, EURONEXT). As it happens with stocks, you need to select a brokerage to access trading. Explore our list of available brokers to find the one to help execute your strategies. Don't forget to do your research before getting to trading. Explore ETFs metrics in our ETF screener to find a reliable opportunity.
SCHD invests in stocks. See more details in our Analysis section.
SCHD expense ratio is 0.06%. It's an important metric for helping traders understand the fund's operating costs relative to assets and how expensive it would be to hold the fund.
No, SCHD isn't leveraged, meaning it doesn't use borrowings or financial derivatives to magnify the performance of the underlying assets or index it follows.
In some ways, ETFs are safe investments, but in a broader sense, they're not safer than any other asset, so it's crucial to analyze a fund before investing. But if your research gives a vague answer, you can always refer to technical analysis.
Today, SCHD technical analysis shows the buy rating and its 1-week rating is buy. Since market conditions are prone to changes, it's worth looking a bit further into the future — according to the 1-month rating SCHD shows the buy signal. See more of SCHD technicals for a more comprehensive analysis.
Today, SCHD technical analysis shows the buy rating and its 1-week rating is buy. Since market conditions are prone to changes, it's worth looking a bit further into the future — according to the 1-month rating SCHD shows the buy signal. See more of SCHD technicals for a more comprehensive analysis.
Yes, SCHD pays dividends to its holders with the dividend yield of 3.75%.
SCHD shares are issued by The Charles Schwab Corp.
SCHD follows the Dow Jones U.S. Dividend 100. ETFs usually track some benchmark seeking to replicate its performance and guide asset selection and objectives.
The fund started trading on Oct 20, 2011.
The fund's management style is passive, meaning it's aiming to replicate the performance of the underlying index by holding assets in the same proportions as the index. The goal is to match the index's returns.