Schwab US Dividend Equity ETF pump incoming?You're looking at Schwab US Dividend Equity ETF, symbol SCHD, and have some clear price targets and potential scenarios in mind.
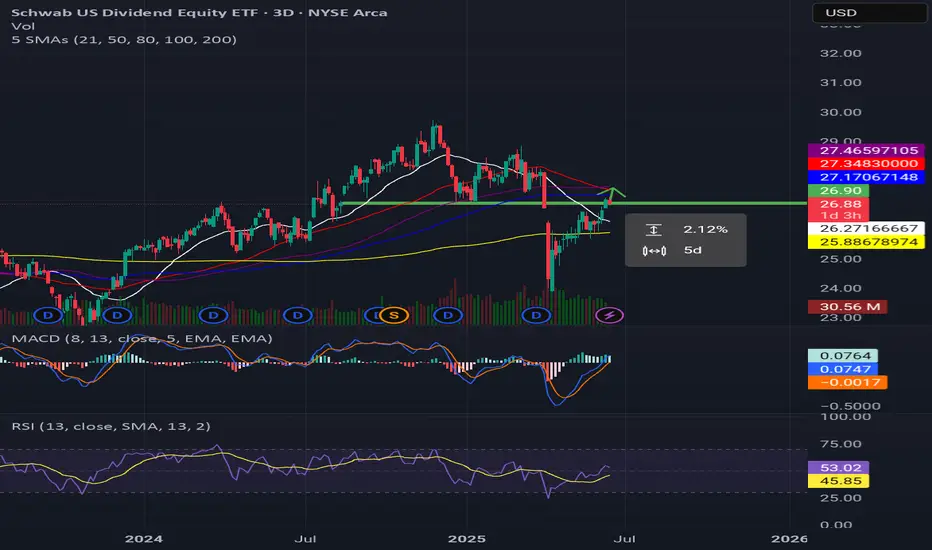
Based on the current information, SCHD's last price at 10:20:50 AM PDT on June 16, 2025, is **$26.875**.
Here's a breakdown of your analysis:
* **Key Resistance for Upside:** You're looking for SCHD to **hold above $26.90** for continuous upside.
* **Upside Target:** If it holds, your next target is at least **$27.40** in the next few days.
* **Potential Downside:** You acknowledge it could drop to **$26.40**.
* **200-Day Moving Average:** The 200-day moving average is at **$25.886**, which you suggest might be retested.
* **Shorting Opportunity:** If the 200-day moving average is retested and it doesn't make a higher high first, you'd consider a short position.
* **Scaling In:** If it hits a **higher high of $27.00** in the next few hours, you'd consider slowly scaling in.
It's important to remember that these are technical analysis points and market movements can be unpredictable. Keeping an eye on the volume and overall market sentiment along with these price levels will be crucial for your trading decisions.
SCHD trade ideas
Prediction line and reason for SCHD's long-term to medium-term First, when looking at all charts, let's consider them as a "Momi Ai" market... Even if the previous candles indicate a clear trend, consider that it might enter a Momi Ai phase in the future.
When you see someone talking about their current evaluation yield or realized yield, and you just think, "Wow, that's impressive," consider yourself a fool. You must check the period over which that evaluation yield or realized yield is assessed. Whether it's a few days, months, or years... And then you should convert it objectively into an annual yield, record it, compare it, and make a judgment afterward.
Similarly, terms like bull market, bear market, trend market, or Momi Ai market are only valid after defining a period. This is the time theory emphasized by Ichimoku Sanjin.
So, when thinking about the above chart as an example... My ability to see long periods is still lacking, unlike Hosoda Tesei, who could see periods of several hundred days. For now, let's lightly look at the candles within the blue box, which create the leading span 2 over the past 52 days. It has come down as much as it rose in an S-wave form. To become the Momi Ai I emphasize, it should lightly pass through the leading span 2 in the form of number 1, go near the previous high, and then come down. You can draw a predictive line in this form. If it's a Momi Ai release from a long-term perspective, and it rebounds using leading span 2 as a stepping stone in the form of number 3, it can be seen as a moment of opportunity for betting.
Conversely, if it turns into a downtrend from the current candle position... If you predict a Momi Ai down release, it will use the current point as a stepping stone to turn downward.
Mid-term: Let's look at the yellow box for the mid-term. This time, the baseline should be the center, but the central value passing through the yellow box, other than the recently formed baseline, is not indicated. But let's consider it as a Momi Ai for now. Extend the recently formed baseline to the past 26 days, set it near the central value, and after a decline, if it doesn't rise as much as it fell, and declines again near the center, it has formed a typical Momi Ai shape in a downward-biased Momi Ai. To become a Momi Ai again, it needs to show adjustments for a few days and approach the baseline. Then it will fall as much as it rose after leaving the baseline. Even if it tries to rise using the baseline as a stepping stone, after a period adjustment, the leading span 1 above is blocking it, and there is a resistance zone, so it may probabilistically fall again. You can predict pattern number 2.
Short-term: Now let's look at the green box that creates the conversion line. It's almost a one-way upward i-wave with slight resistance. To become a short-term Momi Ai, it should be pushed to the conversion line after receiving resistance at the cloud intersection point... But if you limit it to the short-term period, you can dream of a three-wave pattern accompanied by a period if it creates a suitable second wave after making the first wave in 6 days. Check if it accompanies the price and expect a short-term moment of opportunity. There is also a high possibility of being pushed back to the baseline. However, as mentioned above, if it is pushed back to the baseline, it will meet cloud resistance, and that position may be at a lower price level than the current position. If it is pushed back to the baseline, it may fall further, leave the baseline, and wait until it comes down to the previous low of the mid-term, and expect a mid-term Momi Ai near that area. Buying near that area may be probabilistically better.
Chikou Span: I used the indicator that creates Ichimoku's 9-week candle as a 9-day candle, and applied the original content that the trend of the gap between the Chikou Span and the solid line is more important, and converted it to a 26-day candle. In the lower indicator of the picture, you can see the gap between the Chikou Span and the solid line at a glance. The deficit area over the past 28 days is well-formed in a rugby ball shape, and it seems like a favorable turn of the Chikou Span is about to occur. Even if the solid line just moves sideways, it will turn into a bullish candle. So, another sign is created.
Three-wave: If the three-wave accompanied by time adjustment and price adjustment in number 4 above can break through the resistance zone and rise, it is the most ideal form and can be the strongest and most profitable pattern.
Today's Purchase: So, I made a purchase today.

The Dividend King: $SCHD🚀 All Hail SCHD - The Dividend Fan Favorite! 🔥
Ticker: Schwab U.S. Dividend Equity ETF ( AMEX:SCHD )
Timeframe: Daily Chart
Why You Can't Ignore SCHD:
SCHD is the GOAT of dividend ETFs. With its strong track record of outperforming, stable cash flows, and juicy dividend yield, this ETF is a must-have for dividend enthusiasts. 🤑
The Setup:
Support Bounce: We're seeing AMEX:SCHD rebound from key demand zones at $26.95. Bulls are clearly defending this territory.
Wave Progression: Elliott Wave patterns suggest a massive Wave 5 move incoming—hello, ATHs! 🚀
Targets:
Target 1: $29.50
Target 2: $31.50 (beyond here, moon territory 🌕).
Why SCHD?
- Dividend Royalty: Consistent, growing payouts backed by high-quality companies.
- Low Fees: Who doesn't love keeping more of their dividends?
- Compound Wealth: Reinvest dividends, and watch your portfolio snowball into retirement glory.
Call to Action:
Stop thinking. Start building wealth with SCHD. It's not just an ETF; it's a movement. 🌟
Dividend Fanboys Unite! 💪 Let’s ride this wave to financial freedom!
Are you in? 💬 Share your thoughts below! 🚨

SCHD Long-Term Outlook - 40%+ in the Next 3 YearsTicker: SCHD (Schwab U.S. Dividend Equity ETF)
Timeframe: 1M (Monthly)
Analysis:
SCHD has consistently shown strong performance since its inception, benefiting from a diversified portfolio of dividend-paying stocks. The chart highlights a classic Elliott Wave structure:
Wave (1): Initial growth phase after inception.
Wave (2): Consolidation during the 2015-2016 market slowdown.
Wave (3): Long-term bullish rally, supported by broader market trends and stable dividends.
Wave (4): Recent pullback due to macroeconomic headwinds (rising rates, inflation concerns).
Wave (5): Forecasted bullish continuation toward $36.63 (Target 2), with an interim target at $32.64 (Target 1).
The ETF's resilience through economic cycles and its consistent dividend growth make it an excellent candidate for long-term portfolios.
Key Levels
- Entry Zone: Current price around $27.37.
- Target 1: $32.64 (+19% from current levels).
- Target 2: $36.63 (+33% from current levels).
I- Invalidation: A breakdown below $24.00 would negate the bullish wave structure.
Fundamentals
- Dividend Yield: ~3.5% (Varies slightly due to reinvestments).
- Macro Outlook: Dividend-focused ETFs like SCHD are attractive in high-rate environments due to their steady cash flow. This complements a balanced portfolio seeking growth and income.
- Sector Weighting: Heavy allocation toward financials, healthcare, and consumer staples—stable industries in uncertain markets.
Conclusion
SCHD presents a compelling long-term growth opportunity with solid dividend reinvestment potential.
Investors looking for a buy-and-hold strategy should consider adding this ETF to their portfolios, especially for retirement-focused accounts like Roth IRAs.
📈 Let me know your thoughts! Are you holding SCHD in your portfolio?

SCHD , Bounce VS Continuing Momentum just a thought
SCHD facing a decent support area
and Fibonacci 0.5 , a bounce is expected
lets wait and see

Why SCHD Could Be a Quick Win for Savvy Scalpers Eyeing Upside
As always, we like to keep it clean and simple, with technicals and analysis that's easy to see and understand. Let's get into it:
The Schwab U.S. Dividend Equity ETF (SCHD) has recently experienced a downturn, but several factors suggest a near-term upward reversal:
Technical Indicators:
1. SCHD's 100-day and 200-day simple moving averages are $27.95 and $26.79, respectively, with the current price above both, suggesting a longer-term bullish trend
2. StochRSI oversold on mult timeframes
3. Reached limit of reversal move after a Wave 5, which can act as near-term support
Recent Developments:
Dividend-paying stocks, including those in SCHD, have faced challenges due to volatility in the 10-year Treasury yield. However, with expectations of more stable interest rates, dividend-focused investments like SCHD could become more attractive.
Investor interest in dividend-paying equity ETFs has increased, with inflows more than doubling over the past month. This heightened demand could positively impact SCHD's price.
We see a near-term reversal to the $28.80 area -- a $0.50/share increase from current levels .
Be alert.
Trade green.

SCHD Getting Back on Track?Easily the best cash-flow dividend ETF, AMEX:SCHD seems to be in the process of getting back on its long-term track following the easy money excesses of the Fed's post-pandemic policies.
This forecast is a bullish scenario, imo, that might even accommodate a modest recession. The large-cap value stocks in SCHD tend to hold up well during market volatility.

SCHD - more upsidehi traders
Let's take a look at SCHD weekly chart.
As we can see SCHD has been in a long-term downtrend.
Since January 2022 it's been in a mid-term correction which seems to be getting to the end.
The price broke above the downsloping resistance already.
If we get a follow-through, SCHD will make new all time high.
RSI broke the down-trend on weekly which confirms our bullish bias.
Our target is at 0.618 fib extension ( 92$- 94 $ ).

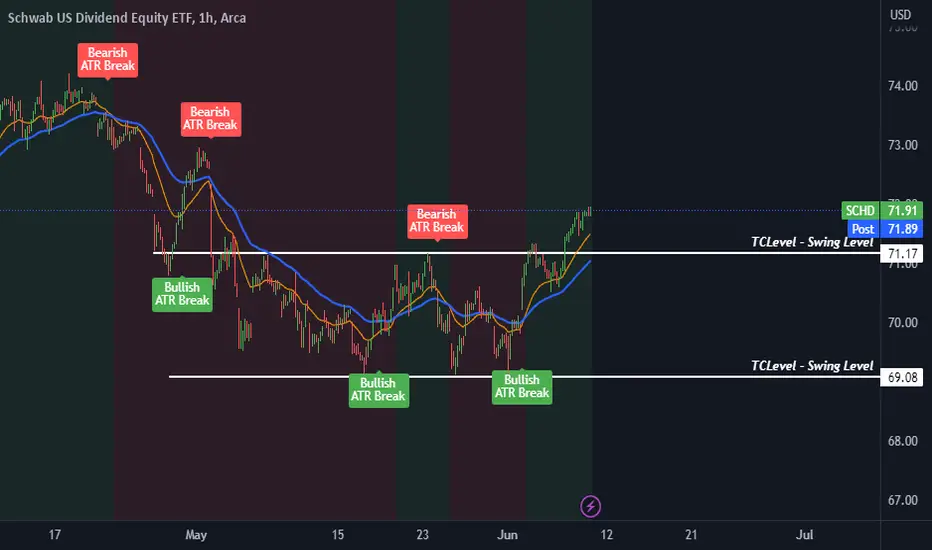
Bullish ComboFinally a good breakout of the channel with crossover and price action.
$72.45 - $73.7 are the next levels.
SCHD is coming sooooon bulll??
SCHG momentum is dying now.
but 200ma will be support in weekly time frame.
let's watch what happen in prz
^^

SCHD - SCHWAB US DVD EQUITY ETFIf you have no idea what to buy, then this one might be the best ETF option to consider in your basket!
You will get your dividend every quarter without doubt.
Price will also continue to rise as long as the State is exist on the earth!
Dividend 0.70
Ex-Date Mar08 '23
Dividend Yield 3.6%

targetting long term trendline targetting long term trendline
50% of entire price action;
-30% from current price;

Two types of correctionsEvery equity will have corrections. It is normal and healthy for the long-term bull market.
SCHD or DIA for example. I believe the correction has begun. In the next 21-30 days. We will see if it is a small correction or a bigger one. I don't recommend shorting the market if you don't know what you are doing.
If you want to build your position. Follow the range I provided could be useful.
As for now, cash is king!
For self-education use only. Not financial advice.

Schwab U.S. Dividend Equity ETF (SCHD): Time To Watch: USA Schwab U.S. Dividend Equity ETF (SCHD): Time To Watch: USA
A Profit & Solutions Strategy

Entry Point NowIf you are looking to get into this ETF I believe now is a good time as it is at a very low but still positive value. I do not think this ETF is leaving the scene any time soon so putting your money in it for dividends could be a good choice.
Good on dividends, however, this ETF has a moderate risk involved which is why I would recommend it to someone who has a larger portfolio and wants to diversify even further. I think there are better ETFs especially for those who just started trading, I have revied some other ETF's which can be found in my profile.

Good ETF for the long termThis ETF has been performing well, however, it is one of the slower and less predictable ETF's I have seen and I believe there is unnecessary risk involved in this one. There are better ETF's out there, I personally do not have many shares of SCHD. If you do like to diversify this does still seem like a good place to park your money and get dividends as long as you have other better ETF's in your portfolio. I will be doing looking more closely at the graph to see what we/ I should do in the short term.
I have reviewed other ETF's, you can check out my profile for better dividend-paying and safer ETFs and others you should stay away from if you would like.
Of course, this is all just my opinion and could be totally wrong, hope the little information I could provide finds you well!

SMA Verses EMAI'm really noticing lately that some investment vehicles definitely show simple moving averages to be of more significance than exponential moving averages as in case in point. Apparently you really need to back-test both on each different asset to know which to use on it.
