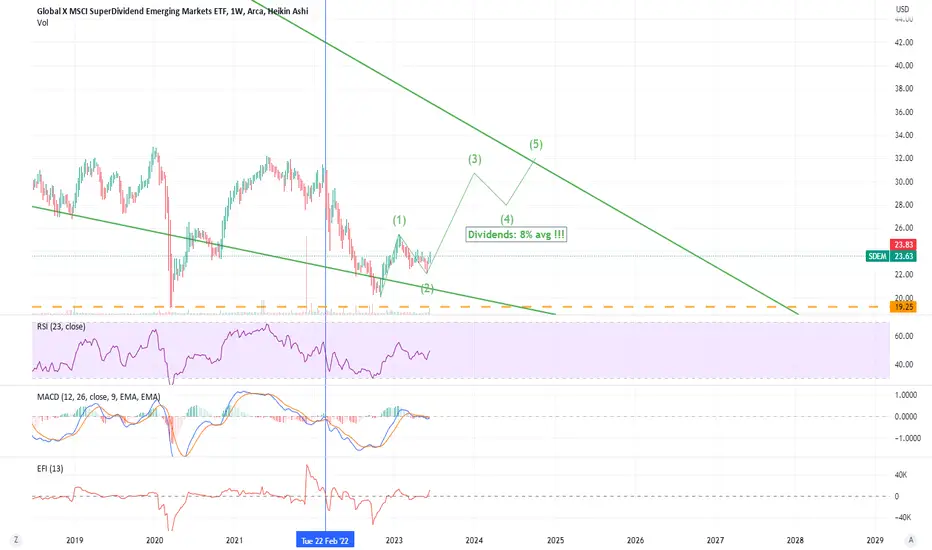
SDEM LONG (SuperDividend Emerging Markets ETF)SDEM
(Global X MSCI SuperDividend Emerging Markets ETF)
While Antony Blinken is visiting People's Republic of China, it's time to look at emerging markets.
Looks like emerging markets are going out of the recession. Especially South Asia countries, Brazil, Chile, Mexico. For some time it will be sl
Key stats
About Global X MSCI SuperDividend Emerging Markets ETF
Home page
Inception date
Mar 16, 2015
Structure
Open-Ended Fund
Dividend treatment
Distributes
Distribution tax treatment
Qualified dividends
Income tax type
Capital Gains
Max ST capital gains rate
39.60%
Max LT capital gains rate
20.00%
Primary advisor
Global X Management Co. LLC
Distributor
SEI Investments Distribution Co.
SDEM offers an equal-weighted alternative to the emerging market high-dividend-yield space. The fund holds the 50 highest-yielding stocks after screening for consistent dividends over the year (or, if per-share dividends have decreased somewhat, that the payout ratio has not decreased). The fund also screens out stocks at the very bottom of price performance in an attempt to weed out stocks with high yield driven by falling prices. SDEM`s equal weighting typically produces a portfolio with a bias toward smaller firms. To achieve diversification, country and sector exposure are each capped at 35%. The index is rebalanced on a quarterly basis starting each February. Prior to Nov. 16, 2016, the funds name is Global X SuperDividend Emerging Markets ETF and tracked the INDXX SuperDividend Emerging Markets Index, which excluded South Korea and Taiwan.
Classification
What's in the fund
Exposure type
Finance
Energy Minerals
Stock breakdown by region
Top 10 holdings

Summarizing what the indicators are suggesting.
Oscillators
Neutral
SellBuy
Strong sellStrong buy
Strong sellSellNeutralBuyStrong buy
Oscillators
Neutral
SellBuy
Strong sellStrong buy
Strong sellSellNeutralBuyStrong buy
Summary
Neutral
SellBuy
Strong sellStrong buy
Strong sellSellNeutralBuyStrong buy
Summary
Neutral
SellBuy
Strong sellStrong buy
Strong sellSellNeutralBuyStrong buy
Summary
Neutral
SellBuy
Strong sellStrong buy
Strong sellSellNeutralBuyStrong buy
Moving Averages
Neutral
SellBuy
Strong sellStrong buy
Strong sellSellNeutralBuyStrong buy
Moving Averages
Neutral
SellBuy
Strong sellStrong buy
Strong sellSellNeutralBuyStrong buy
Displays a symbol's price movements over previous years to identify recurring trends.
Related funds
Frequently Asked Questions
An exchange-traded fund (ETF) is a collection of assets (stocks, bonds, commodities, etc.) that track an underlying index and can be bought on an exchange like individual stocks.
SDEM trades at 26.56 USD today, its price has fallen −0.33% in the past 24 hours. Track more dynamics on SDEM price chart.
SDEM net asset value is 26.62 today — it's risen 4.72% over the past month. NAV represents the total value of the fund's assets less liabilities and serves as a gauge of the fund's performance.
SDEM assets under management is 37.48 M USD. AUM is an important metric as it reflects the fund's size and can serve as a gauge of how successful the fund is in attracting investors, which, in its turn, can influence decision-making.
SDEM price has risen by 2.74% over the last month, and its yearly performance shows a −3.17% decrease. See more dynamics on SDEM price chart.
NAV returns, another gauge of an ETF dynamics, showed a 5.49% increase in three-month performance and has increased by 3.44% in a year.
NAV returns, another gauge of an ETF dynamics, showed a 5.49% increase in three-month performance and has increased by 3.44% in a year.
SDEM fund flows account for −9.43 M USD (1 year). Many traders use this metric to get insight into investors' sentiment and evaluate whether it's time to buy or sell the fund.
Since ETFs work like an individual stock, they can be bought and sold on exchanges (e.g. NASDAQ, NYSE, EURONEXT). As it happens with stocks, you need to select a brokerage to access trading. Explore our list of available brokers to find the one to help execute your strategies. Don't forget to do your research before getting to trading. Explore ETFs metrics in our ETF screener to find a reliable opportunity.
SDEM invests in stocks. See more details in our Analysis section.
SDEM expense ratio is 0.68%. It's an important metric for helping traders understand the fund's operating costs relative to assets and how expensive it would be to hold the fund.
No, SDEM isn't leveraged, meaning it doesn't use borrowings or financial derivatives to magnify the performance of the underlying assets or index it follows.
In some ways, ETFs are safe investments, but in a broader sense, they're not safer than any other asset, so it's crucial to analyze a fund before investing. But if your research gives a vague answer, you can always refer to technical analysis.
Today, SDEM technical analysis shows the buy rating and its 1-week rating is buy. Since market conditions are prone to changes, it's worth looking a bit further into the future — according to the 1-month rating SDEM shows the buy signal. See more of SDEM technicals for a more comprehensive analysis.
Today, SDEM technical analysis shows the buy rating and its 1-week rating is buy. Since market conditions are prone to changes, it's worth looking a bit further into the future — according to the 1-month rating SDEM shows the buy signal. See more of SDEM technicals for a more comprehensive analysis.
Yes, SDEM pays dividends to its holders with the dividend yield of 6.26%.
SDEM trades at a premium (0.69%).
Premium/discount to NAV expresses the difference between the ETF’s price and its NAV value. A positive percentage indicates a premium, meaning the ETF trades at a higher price than the calculated NAV. Conversely, a negative percentage indicates a discount, suggesting the ETF trades at a lower price than NAV.
Premium/discount to NAV expresses the difference between the ETF’s price and its NAV value. A positive percentage indicates a premium, meaning the ETF trades at a higher price than the calculated NAV. Conversely, a negative percentage indicates a discount, suggesting the ETF trades at a lower price than NAV.
SDEM shares are issued by Mirae Asset Global Investments Co., Ltd.
SDEM follows the MSCI Emerging Markets Top 50 Dividend. ETFs usually track some benchmark seeking to replicate its performance and guide asset selection and objectives.
The fund started trading on Mar 16, 2015.
The fund's management style is passive, meaning it's aiming to replicate the performance of the underlying index by holding assets in the same proportions as the index. The goal is to match the index's returns.