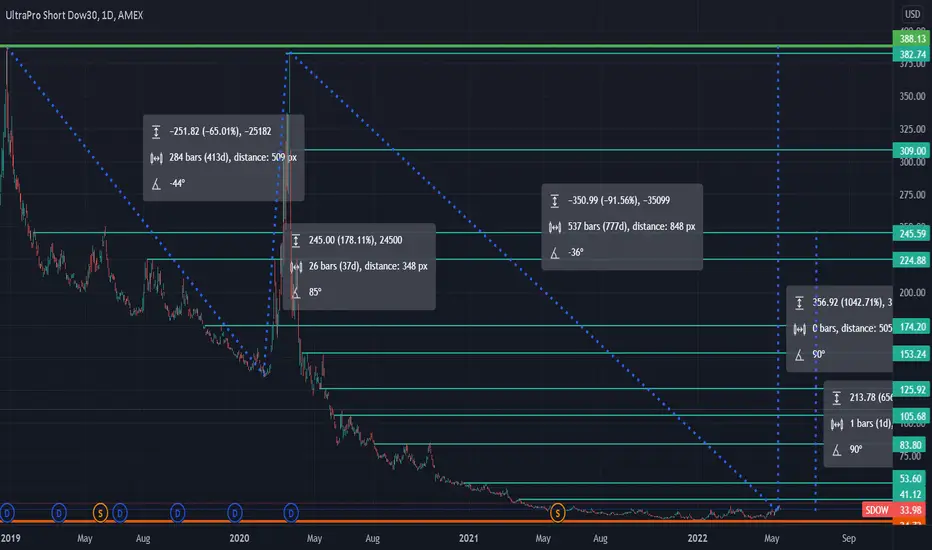
SDOW a Dow Shorting ETF Long from an Intermediate Term BottomSDOW has leveled off at a near-term bottom after a downtrend as confirmed by bullish
divergence on the RSI and MACD while the price went sideways in consolidation.
Volatility has contracted as have trading volumes. I see this as a buying
opportunity with a stop loss of 20.5 below the low pivo
Key stats
About UltraPro Short Dow30
Home page
Inception date
Feb 11, 2010
Structure
Open-Ended Fund
Replication method
Synthetic
Dividend treatment
Distributes
Distribution tax treatment
Ordinary income
Income tax type
Capital Gains
Max ST capital gains rate
39.60%
Max LT capital gains rate
20.00%
Primary advisor
ProShare Advisors LLC
Distributor
SEI Investments Distribution Co.
SDOW is an aggressive, 1-day bet against the Dow Jones Industrial Averageperhaps the most famous index in the world. The DJIA overweights on industrials relative to our large-cap benchmark, and underweights technology. In particular, SDOW represents a bet against a narrow basket of firms rather than the large-cap market as a whole. The fund is designed to deliver 3x the inverse performance of the 30 firms in the DJIA, weighted by price. This geared inverse exposure is daily, and anyone holding for longer than a day will be exposed to impacts of compounding, whichespecially in a 3x geared productwill prevent the fund from delivering its promised exposure over extended periods. Investors who don't have the expertise or knowledge needed to true-up their exposure every day should either avoid SDOW or hold it for its prescribed 1-day holding period. The fund's expense ratio matters less than all in trading costs.
Related funds
Classification
What's in the fund
Exposure type
Government
Cash
Stock breakdown by region
Top 10 holdings

SDOW: Bullish Dragon and Deep Cypher with PPO ConfirmationThe 3x Inverse ETF of the Dow Jones Industrial Average has formed a Bullish Dragon and has broken free from it at the PCZ of a Bullish Deep Cypher with a Bullish PPO Confirmation Circle. If things go as one would expect, then we will see this ETF pump up to at least the 61.8% Retrace, but given how

SDOW a triple leveraged ETF shorts the DOWSDOW is shown here on a 30 minute chart current rising above a parallel descending channel
which is within a longer trend of a downward-facing megaphone pattern where it is currently
situated near the top of the megaphone. I have drawn the two trendlines onto the chart
and added an RSI indicat

SDOW | Easy Money | DOW Bear ETFThe fund invests in financial instruments that ProShare Advisors believes, in combination, should produce daily returns consistent with the fund's investment objective. The index is a price-weighted index and includes 30 large-cap, "blue-chip" U.S. stocks, excluding utility and transportation compan

Long sdowI don’t see how the market continues on an uptrend after cpi, and the Dow is seriously overextended
Reasoning:
Trendline, daily, weekly and monthly supports
Weekly price exhaustion
Bottom of broadening pattern
Favourable volume

SDOW Is it time to buy yet? Algo’s keeping the DJI under a slow controlled burn so far, Kept from crashing. But something has to give


SDOW..buy 15 min trickWe take a position when price leaves out of 15 min opening bar...so entery and put a stop of the previous candel


ProShares UltraPro Short Dow 30 ETF Is The US market crash ?Is The US market crash coming ?
We have 3 types of “crashes”
Correction <15% downward movement in a major indicy
Bear Market <20% downward movement in a major indicy
Black Swan event, something very unexpected that tanks the market, think 1987, 1929, challenger disaster, 911 and so on.
The four
See all ideas
Summarizing what the indicators are suggesting.
Oscillators
Neutral
SellBuy
Strong sellStrong buy
Strong sellSellNeutralBuyStrong buy
Oscillators
Neutral
SellBuy
Strong sellStrong buy
Strong sellSellNeutralBuyStrong buy
Summary
Neutral
SellBuy
Strong sellStrong buy
Strong sellSellNeutralBuyStrong buy
Summary
Neutral
SellBuy
Strong sellStrong buy
Strong sellSellNeutralBuyStrong buy
Summary
Neutral
SellBuy
Strong sellStrong buy
Strong sellSellNeutralBuyStrong buy
Moving Averages
Neutral
SellBuy
Strong sellStrong buy
Strong sellSellNeutralBuyStrong buy
Moving Averages
Neutral
SellBuy
Strong sellStrong buy
Strong sellSellNeutralBuyStrong buy
Displays a symbol's price movements over previous years to identify recurring trends.
Frequently Asked Questions
An exchange-traded fund (ETF) is a collection of assets (stocks, bonds, commodities, etc.) that track an underlying index and can be bought on an exchange like individual stocks.
SDOW trades at 43.26 USD today, its price has risen 3.99% in the past 24 hours. Track more dynamics on SDOW price chart.
SDOW net asset value is 43.22 today — it's risen 7.25% over the past month. NAV represents the total value of the fund's assets less liabilities and serves as a gauge of the fund's performance.
SDOW assets under management is 223.72 M USD. AUM is an important metric as it reflects the fund's size and can serve as a gauge of how successful the fund is in attracting investors, which, in its turn, can influence decision-making.
SDOW price has risen by 7.19% over the last month, and its yearly performance shows a −25.82% decrease. See more dynamics on SDOW price chart.
NAV returns, another gauge of an ETF dynamics, showed a −14.22% decrease in three-month performance and has decreased by −21.93% in a year.
NAV returns, another gauge of an ETF dynamics, showed a −14.22% decrease in three-month performance and has decreased by −21.93% in a year.
SDOW fund flows account for 3.97 M USD (1 year). Many traders use this metric to get insight into investors' sentiment and evaluate whether it's time to buy or sell the fund.
Since ETFs work like an individual stock, they can be bought and sold on exchanges (e.g. NASDAQ, NYSE, EURONEXT). As it happens with stocks, you need to select a brokerage to access trading. Explore our list of available brokers to find the one to help execute your strategies. Don't forget to do your research before getting to trading. Explore ETFs metrics in our ETF screener to find a reliable opportunity.
SDOW invests in bonds. See more details in our Analysis section.
SDOW expense ratio is 0.95%. It's an important metric for helping traders understand the fund's operating costs relative to assets and how expensive it would be to hold the fund.
SDOW is an inverse fund, meaning it's structured to generate returns opposite to the trends of the underlying index or assets.
In some ways, ETFs are safe investments, but in a broader sense, they're not safer than any other asset, so it's crucial to analyze a fund before investing. But if your research gives a vague answer, you can always refer to technical analysis.
Today, SDOW technical analysis shows the buy rating and its 1-week rating is sell. Since market conditions are prone to changes, it's worth looking a bit further into the future — according to the 1-month rating SDOW shows the sell signal. See more of SDOW technicals for a more comprehensive analysis.
Today, SDOW technical analysis shows the buy rating and its 1-week rating is sell. Since market conditions are prone to changes, it's worth looking a bit further into the future — according to the 1-month rating SDOW shows the sell signal. See more of SDOW technicals for a more comprehensive analysis.
Yes, SDOW pays dividends to its holders with the dividend yield of 2.36%.
SDOW trades at a premium (0.09%).
Premium/discount to NAV expresses the difference between the ETF’s price and its NAV value. A positive percentage indicates a premium, meaning the ETF trades at a higher price than the calculated NAV. Conversely, a negative percentage indicates a discount, suggesting the ETF trades at a lower price than NAV.
Premium/discount to NAV expresses the difference between the ETF’s price and its NAV value. A positive percentage indicates a premium, meaning the ETF trades at a higher price than the calculated NAV. Conversely, a negative percentage indicates a discount, suggesting the ETF trades at a lower price than NAV.
SDOW shares are issued by ProShare Advisors LLC
SDOW follows the DJ Industrial Average. ETFs usually track some benchmark seeking to replicate its performance and guide asset selection and objectives.
The fund started trading on Feb 11, 2010.
The fund's management style is passive, meaning it's aiming to replicate the performance of the underlying index by holding assets in the same proportions as the index. The goal is to match the index's returns.