SH trade ideas
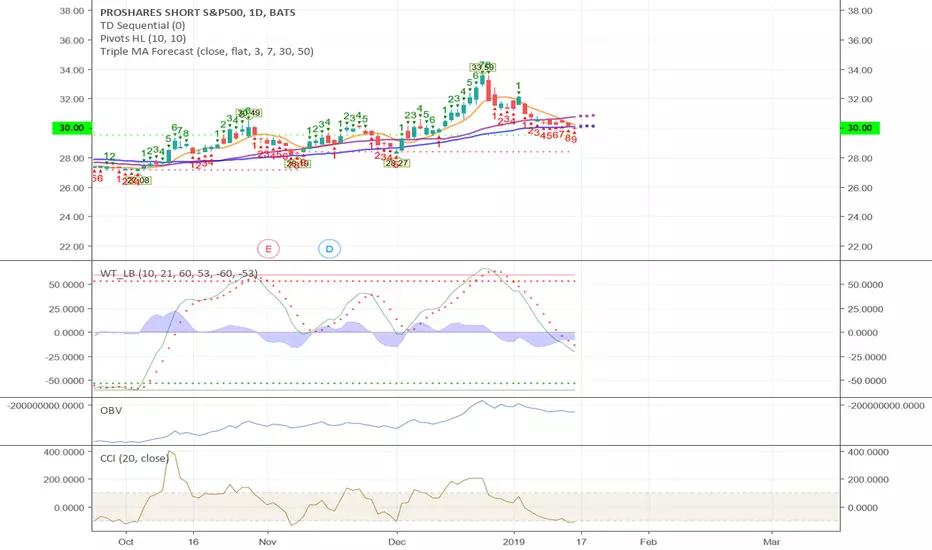
SH volume confirms Smart Money is Shorting the S&PVolume confirms everything but sometimes you have to go looking around to find the volume you are looking for. The normal volume, the Volume Profile, or in this case, the volume on the inverse ETF of the stock market/indices. Below is the three month (1q) chart for SH and we see massive volume candles confirming the tops of wave 3 and 5 from my posts on SPX. Right now I feel we are at the top of our bull trap after the Fed's press conference yesterday and the S&P will be going down and SH will be going up.
The chart below shows the RSI and MACD have turned a corner with price action on the 4H and divergence is settling in. SH might set another local low but I don't think we are going past our low of October. I see a potential inverted complex head and shoulders developing on the 4h and it looks like if it is there it will take another 2 weeks for SH and SPX to get moving.
Finally, here is SPX on the 3m (1Q) chart and we don't see anything like the same volume profile as SH. Why? Most people don't know about inverse ETFs and that you can short the broader market without margin. Either their retirements don't permit them to take those positions or their financial education has a gap. Those that do know showed their hand with the volume on SH.


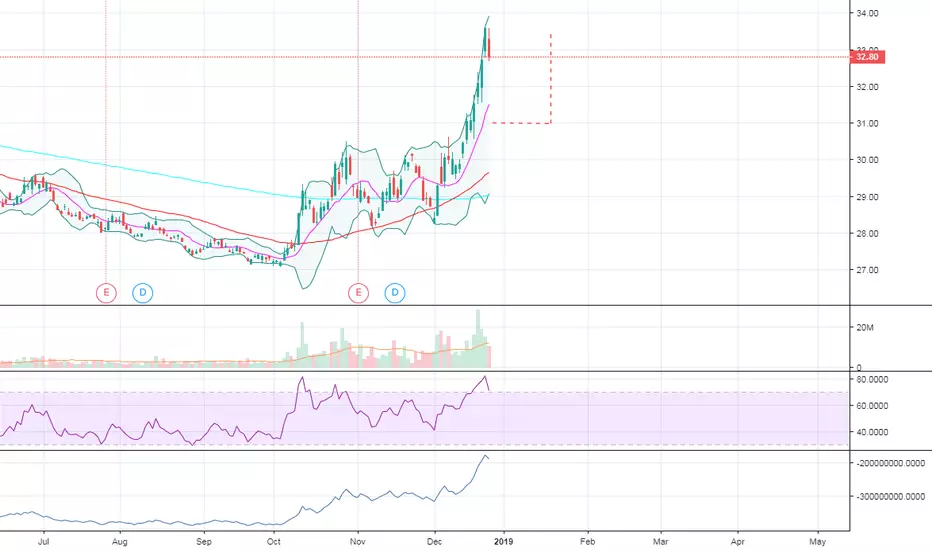
SH drop on SPY bounceSPY will bounce so far early bullish engulfing printed. Let's see if there is continuation and see if this buying holds. The first bounce is always strongest.
Bought a Put $2 Strike $34 Exp Jan 18. Price target $31. Payout $100. Stop loss $33 if price levels continue higher I will take off trade for as little of a loss as possible.
Delta -71
High probability trade, Low Risk.
ONCE IN A LIFETIME OPPORTUNITY TO BUY PROSHARES SHORT S&P500 ETFONCE IN A LIFETIME OPPORTUNITY TO BUY PROSHARES SHORT S&P500 ETF, BUY NOW AT 27.24 FOR A TARGET OF 145.....JUST BUY AND FORGET

BUY PROSHARES SHORT S&P500 NOW 27.20 FOR A TARGET OF AROUND 145BEST TIME TO HEDGE YOUR PORTFOLIO AND BUY PROSHARES SHORT S&P500,,,BUY NOW AT 27.20 AND WAIT FOR ALL THE CORRECTION TO HAPPEN IN S&P 500 AROUND 50 TO 60% PERCENT CORRECTION AND THEN EXIT...

SPX Inverse ETF - Bullish DivergenceI'd say that's quite bearish for SPX (bullish for the inverse etf). Incredible risk/reward at this point.


Bullish count SH - inverse SP500 etfTwo counts here, one bullish and one bearish. I am leaning towards a deeper correction in the SP500 and so prefer the bullish red count for this inverse etf. The red count would suggest that we are now in a B wave correction before wave C starts with deeper declines in the SP500. A couple of things make me like the red count better.....the alternation of the 2 correction and the wave 5 being a 61.8 extension of waves 1-3. I have included a blue count that suggests the correction could be over already but I don't think the blue 4th wave correction of wave A was big enough hence me preferring the red count. That's confusing.....but anyway.....

SH: Hedging my portfolio with SH longsI reccomend purchasing $SPY puts, and/or going long SH at market open tomorrow.
We can use a stop loss at 38.36, which is rather tight but safe, and go short risking 0.5-1% of the account.
All in all, the range expansion validation target failed to confirm the bullish momentum in SPX, so I'm inclined to revert back to shorting it. We might be soon to validate the $DJIA terminal pattern from related ideas too, lower probability, but still within the realm of probability.
That being said, I don't want to close my longer term fundamental/technical stock longs, so, I choose to protect my exposure with $SPY puts, and $SH longs. All in all, factoring in the dividends, and the speculative shorts and puts, there is extremely low risk in holding the trades for longer, even during this pre-election period and beyond.
Good luck with the BOJ today, and tomorrow with FOMC, trade safely.
Cheers,
Ivan Labrie.

Stock Sell-Off Friday Sept 9th Put In Perspective: SH & DOGI am net long stocks. I own-SH. If you view the chart above you will se a steady decline in-SH.
SH-are the inverse of the-S&P 500. SH-seeks daily results that correspond to the inverse (-1x) of the daily performance of the-S&P 500. The fund invests in derivatives that ProShare Advisors believes, in combination, should have similar daily return characteristics as the inverse (-1x) of the daily return of the index.
I do own-SH, as well as DOW-DOG. Why? Portfolio insurance only.
The chart above shows a steady decline in-SH since the February lows.
The phase energy (top lower) has been mostly negative since February.
CHOP has been mostly in the shaded area while CHOP ZONE has been mostly red. This means lower-SH prices.
I have positions in SH-and-DOG for the same reasons I have home owners insurance or health insurance. It gives me protection for wide market swings.
I am never sad if I don't have a fire at my home or require major surgery, two reasons I would have bought home owners or health insurance.
Stocks today: There are no signs that I see for a major shift in the stock market.
Yes, this can change, but for now I add to my positions in quality stocks when the market dips.
Baron Rothschild said “When there is blood on the street, I am buying."
I publish this only as a matter of education. If you have strong, trending stocks, the trend usually re-asserts itself.
I do not believe the sky is falling. Keep cool and do not lose you head, even if those around you do.
Good luck to you with all your trades. Don

A Bull in Bear's Clothing After breaking resistance on 3/23 it had a false breakout and set a new resistance level at $41, then broke a new resistance line on 6/09 at $39 going up to the prior resistance level of 41 then declining again., then testing the $39 dollar level again to continue to decline. A third resistance level has formed at 38.50. Instead of continuing to decline it is been consolidating then broke lower to 38 only to consolidate again, indicating that a larger move either direction might be brewing. Since this ticker is an ETF to short the S&P 500 that has been bullish there may be a gain coming up if it breaks the prior resistance level with an entry above 38.60 to 40 or possibly 41 depending on the severity of the pulback in the S&P 500 if it occurs.

SHORT S$&PYesterday I started adding SH. I bought first 75 shares.
I will be approximatly lineary adding SH shares. When it comes to this year S&P record levels I will check for the break and if there is no break possible add larger quantitiy.
It is not for short term traders. FED and other central banks are doing everything possible to keep feeling of "heaven"


Rounding Bottom in SH/SPY?Bullish rounding bottom in SH/SPY ratio? Also has bullish RSI divergence, too.

SH falling broadening pattern LONG, possible AB=CDSH (short S&P500) is forming a nice falling reverse wedge pattern, also known as broadening pattern. The falling pattern is an indication that the price is likely to break out of the upper boundary. I'm personally looking for an AB=CD pattern, consolidating between 20 and 20.10, and the target at ~20.40.

Arc, double bottom on SH (short S&P) time for a pop!pretty much just what the title says. It's time to be long short S&P! The correction is long overdue! (although the election may postpone the inevitable)

go away in may play while margin debt is soaring good hedge good inverse eft-cci and percent r moving us why these are important in our book on amazon-stoc crossed-money flow good-stop loss on thursday close-first area of concern 50 ma and cloud

THREE CYBER "M" & FIBS WARNING OF MARKET SELL, PART 1: SHThis is part 1 of three views. The SH are the short shares you buy if you think the S&P 500 is going to decline.
I wanted to look at the S&P 500, DOW-30, and QQQ to study Fibonacci time cycles and also to see of there were any bullish signals.
I found versions of bullish butterfly cyber patterns on all three, only, if SH is bullish, the market would be in a sell-off.
At Fib Start there was an impulse leg low. At Fib 1 there was a phase energy reversal.
Fib time cycle 2 was an impulse leg top and a major "C" to "D" reversal.
Fibonacci time cycle 3 is the cyber completion of a bullish formation, and look at the phase energy bars (top).
The phase energy has been building to a positive zero-line cross over (long red arrow). This would most likely mean a market decline.
Now, please move on to part 2, an analysis of the DOW-30.
May all of your trades go well. Don.
