SLV 1H OTE food for thoughts hereLooks like it’s gone for good, but hey—I’m still waiting on that 1H pullback before I touch it.
SLV trade ideas

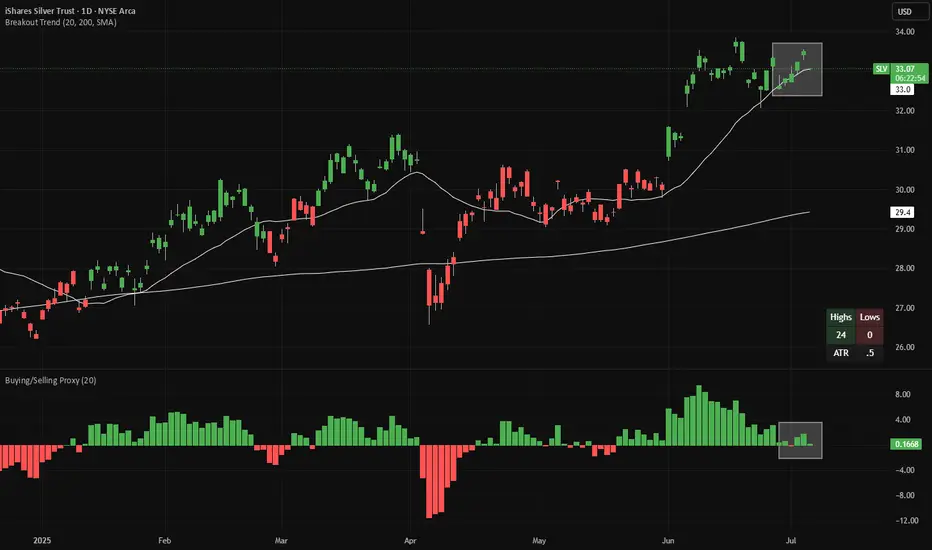
Long Silver - Buy the DipSilver is making 20-day highs (green candles in the main chart), while pulling back towards the 20D EMA line. Meanwhile, looking at a proxy of net buying/selling (bottom panel), we are almost at net selling levels.
There is good risk/reward to buy silver here, with a stop-loss if the price closes at a 20-day low. If a 20-day low is made, the candles will change color from green to red.
Both indicators (Breakout Trend and Buying/Selling Proxy) are available for free on TradingView.
Small SLV positionTaking a small position in SLV here.
Long term looking at the gold to silver ratio trading around 90 If gold holds its grounds and silver plays catch up to a ratio of 70 even 60. I will be playing this position less about price and more about the ratio. If slv breaks all time high I will start selling regardless of price 20% week unless price is parabolic. Then selling will be 50% per week.

All That Glitters Is Not Gold (But Silver?)And another long Idea - this time in the Silver ETF, SLV.
Looking at the daily chart for SLV, a couple of things standout from a few days ago;
- The price just broke the all-time high at 31.80, along with significant resistance at ~31.50, and
- SLV gapped up, leaving tight stops a bit problematic.
As I've said before in this instance I do two things;
1. Wait for a pullback (which we're now seeing?), and
2. Switch to the commodity futures chart (emphasis - I'm not trading the future, just taking a look)
Using the July Silver contract on the CME;
We can see the breakout, and now the retest(s), of two critical highs from the last few months.
Switching down '1' interval, to the 4-hour chart;
We can see 3-4 retests of those old highs, which now may be acting as support. I've drawn in a short-term trendline and resistance. A cross of that trendline and a close above 36.260 should provide a good entry point.
A stop could then be placed at 35.00 (with a close below that on the 4-hour), just below this recent turmoil.
As for targets, this scenario has SLV making new all-time highs - best to just trail and let SLV tell you where to exit.
All that glitters..
My ideas here on TradingView are for educational purposes only. It is NOT trading advice. I often lose money and you would be a fool to follow me blindly.

SILVER Multi year Breakout in the works. SLV /SIAMEX:SLV – Silver Setting Up for a Multi-Year Breakout
Silver is quietly coiling under a major 10+ year breakout level, and AMEX:SLV is right in the center of it — with a powerful setup developing.
🔹 Long-Term Breakout Level: $31.75
AMEX:SLV is pressing up against $31.75, a key breakout spot that hasn't been breached in over a decade.
We're currently printing two inside days following a power candle — classic tension-building price action.
🔹 Sector Tailwinds
Gold ( AMEX:GLD ) is up over 1% today — if silver catches up, AMEX:SLV could explode.
A green day here could confirm the strength we need to trigger a move through that decade-level resistance.
🔹 My Trade Plan:
1️⃣ Initial Entry: Looking to go red-to-green on today’s candle.
2️⃣ Add on Confirmation: Double up on a clean breakout over $31.75.
3️⃣ Execution: Using a mix of AMEX:SLV calls and /SI silver futures contracts to capture the move.
4️⃣ Stop: Below inside day lows or Friday’s low depending on the entry timing.
Why I Like This Setup:
Massive long-term breakout on deck = explosive potential.
Inside days = tight risk, big reward.
Sector momentum is lining up with a clean, tradable chart pattern.

$SLV Silver could finally trend some longer timeframeAMEX:SLV finally show some strength and had a continuation day today, which is rare. I also see it as a good hedge or other position than stocks, which could react less to random moves (or maybe also not - calculate your risk on your own please)
My stop is the red line and I accumulated lower but still see it as a good entry if it stays up here.
Good luck!
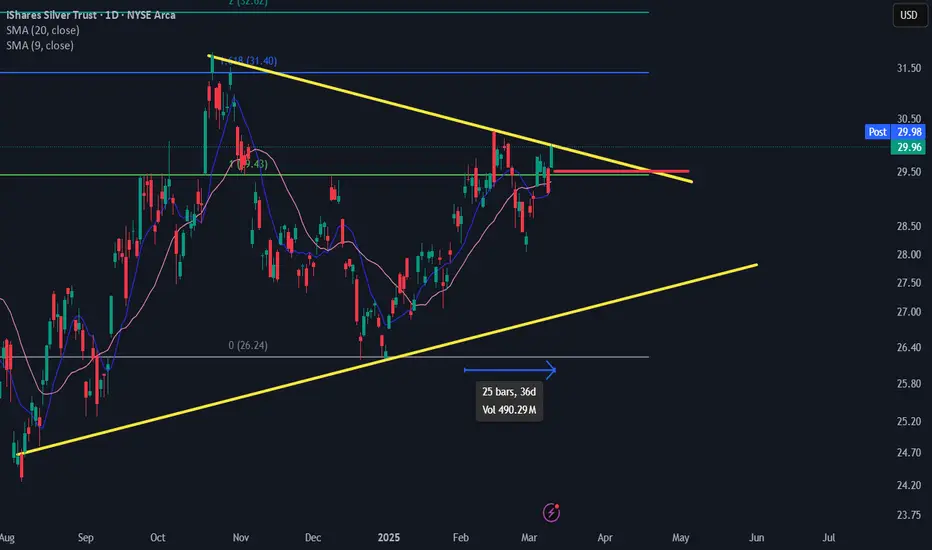
$SLV pullback before the real bull trend starts?Silver looks to be trading in a large rising wedge, I could see the possibility of a pretty substantial pullback should price break down from the pattern.
We have the potential to fall between 30-60% from here should price break the pattern. The level to look for is a break of $22 on the downside, that will be the confirmation that we're moving lower.
I've marked off important support levels on the downside if we break down. A break of the upper resistance would invalidate the idea.

Silver Poised for Upside?SLV is setting up a strong case for a position trade. A similar situation recently played out with Palantir, although with greater risk involved due to being an individual stock, but we don't need to exclude the intrinsic value of precious metals. Multiple timeframes are showing technical confluence and this is something to watch beyond 2024.
Key Points:
SLV has formed a larger, albeit lopsided, cup and handle pattern on the monthly chart with another mild version of the same pattern post 2020. The dip having been formed by the 2022 bear market.
Price has simultaneously found support between the Ichimoku Kumo(formed by an offset of the average price between highs/lows) and a well-defined static support/resistance zone indicating stability.
The "Golden Cross" remains well intact from its formation in Q2 of this year. This is bullish bias.
The slow stochastic, also formed by highs/lows as opposed to a rate of change, has pulled back from overbought territory on both the weekly and daily timeframes. The weekly stochastic appears to be a well balanced oscillator for SLV. I personally find ROC oscillators and MA crosses better for exits.
We do have a bearish engulfing candle on this timeframe suggesting near term weakness, so it's critical to watch for incoming support.
Final Thoughts:
Silver remains structurally strong and we have a bullish case on multiple timeframes. While short term bearishness indicates caution, the overall technical picture suggests solid upside potential.
Support: $26
Resistance: $30.5
Target: $34+

Buy SLV puts at strike price 30, possible correctionBuy SLV puts at strike price 30, possible correction

Will Silver finally moon?Silver has been consolidating near its February 2021 highs for 8 months. Multiple patterns occurred within this range but most failed (see previous posts).
A breakout of a symmetrical triangle appears to be occurring tomorrow, 3/12. A small position was initiated today, and a daily close above 30.30 would be the spot to add more.
Price objectives include 31.4 and 32.62
CSE:SI
AMEX:SLV
Original H&S pattern SLVAdding this chart to idea already published. Failed Breakdown H&S = bullish reversal

SLV breakout in action?There are two ways I look at this chart both currently bullish. First is a failed breakdown on an standard H&S pattern. The second, actually part of that failed breakdown is an inverted H&S pattern, targeting $33 SLV over a 10% move in the short run.

SILVER & SLV TVC:SILVER AMEX:SLV
my thesis:
i see the silver price been trending strong throughout the long run. as long as silver trending up, i see its strong potential to reach price in between 35 to 38. i will keep looking for longs in the future as price always has its potential for uptrend.
for SLV, as long as these two silver market correlated strongly. i have the same vision for SLV to go long.

one more shakeout coming!As much as I hate to admit it, I think that we will have one more major shakeout that will be intense and will cause panic in the precious metals markets. The bullion banks are loaded up with shorts...and yes that could mean that a short squeeze ensues and takes metals up explosively. However, absent some major geopolitical event or similar, I think that the bullion banks will slam the markets one las time...it will hurt big time and test even the most resolute stacker!


SLV LONGThe SLV ETF has recently experienced a significant Change of Character (CHoCH), which is backed by strong volume. This type of move indicates that the price structure has shifted from bearish to bullish, with buyers stepping in as price action shows signs of strength.
What stands out is the 37K volume traded, and $2.6 million in premiums tied to options contracts, with the majority occurring at the ask. This suggests strong demand and a bullish outlook from traders. With the uncertainty in the broader market, SLV has become an attractive safe-haven investment vehicle, likely reflecting increased interest in silver as a store of value.
Given this recent momentum, it’s looking like SLV could be targeting $31.60 in the near term, and possibly even $36 over the next few weeks to months as it continues to trend higher. The combination of market uncertainty and bullish technical signals points to further upside potential.

Silver to double within a year. Again. A picture paints a thousand words. Monkey-see... monkey-do.
Buy silver and hold.
Godspeed.


SLV Long IdeaEntered 1-24 $27.5 calls today @.61 on 5min close above orb with pdh below. bought more on retest of orb for an average of .616 per contract. The goal is to take this at least to a daily confluence level marked in orange which is just shy of a .618 retracement for short entries. Stops are just below PDH

$spy $ag $slv What is going on here?What caused this stock to decouple from the price of silver? Why can they not make money in this environment? This should be at 20. Anybody know what is going on with AG?

$SLV Trade Analysis DarkPoolsChart Overview:
Instrument: iShares Silver Trust (SLV)
Timeframe: 4-hour chart
Indicators on Chart:
Moving Averages: Likely 8 EMA and 21 EMA for short-term trend analysis.
Dark Pool Levels: Represented by white dashed lines at key levels.
Trendlines:
Red Line: Downtrend resistance.
Green Lines: Support forming an ascending wedge after a potential trend reversal.
Horizontal Resistance:
Yellow Line at $29.00: Major psychological and technical resistance.
White Dashed Lines near $28.20 and $26.53: Key dark pool levels.
Key Observations:
Descending Channel Reversal:
SLV was previously in a clear downtrend marked by the red resistance and green support lines.
The recent breakout above the green support line and consolidation near $27 indicates a potential shift in momentum.
Ascending Triangle Formation:
After the breakout from the previous downtrend, the price has formed a triangle pattern, with resistance near $27.08 and ascending support at $26.96.
This formation is often a bullish continuation pattern, suggesting an imminent breakout if the price can breach the resistance.
Dark Pool Levels:
$28.20: An immediate target, aligning with prior price action and a dark pool level.
$26.53: A significant support level where institutional activity may provide a floor for the price.
Resistance and Support Levels:
Resistance:
$27.08: Triangle resistance.
$29.00 - $29.13: Major resistance and likely profit-taking zone.
Support:
$26.96: Immediate ascending support line within the triangle.
$26.53: Key dark pool support level and invalidation zone for a bullish outlook.
Volume:
A breakout above $27.08 should ideally be accompanied by a volume spike to confirm institutional buying and sustained bullish momentum.
Trade Idea:
Entry:
Breakout Entry: Enter above $27.08 with confirmation (strong candle close and increased volume).
Pullback Entry: Enter near $26.96, the lower support of the triangle, for a better risk-reward setup.
Profit Targets:
$28.20: First target aligning with the dark pool level.
$29.00: Major resistance and likely profit-taking zone.
$29.13: Final target, slightly above the psychological resistance zone.
Stop Loss:
Close below $26.53: Invalidation of the bullish setup and indicates a likely continuation of the downtrend.
Risk Management:
Position size should be calculated based on risk tolerance.
Ensure a risk-to-reward ratio of 1:3, considering the entry near $27.08, stop loss at $26.53, and first target at $28.20.
Additional Notes:
Volume Confirmation: A breakout above $27.08 should be accompanied by a surge in volume to validate the move.
Dark Pool Influence: Watch price behavior near $28.20 and $26.53 to gauge institutional activity.
Caution: If the price consolidates too long near the triangle resistance without breaking out, it may signal weakness and increase the probability of a breakdown.

Is everyone offsides on Silver?Silver broke out of a bullish head and shoulders on 10/18/24. This ended up failing and instead was forming the head of a bearish head and shoulders top. The first short entry was the gap down on 12/12/24, the 2nd short was on 12/18. Price objectives are: 24.97 and 23.43
AMEX:SLV
COMEX:SI1!

SLV - More Downside ExpectedSilver is in the midst of an apparent A-B-C corrective wave that could fall as low as 22 while still maintaining a long term up channel. Most likely bottom would be around 25 with a C = A relationship. Good time to pick up some physicals as many expect that China demand and a general silver shortage can boost prices to new all time highs. Some are even predicting triple-digit prices ahead.
