Silver $SLV offering a 10 percent ROI with some Patience: YAWN?$SLV makes a nice long, on silver futures. The gain is not tremendous, but it seems "safe" (A word I loathe using, but will).
With Au trending up, Ag should match it after it finishes this bottom out -- It's down 0.5% pre-market and may fall a full percentage point, at which entrance can be considered.
This won't knock the socks off a thing - but who flicks boogers at actual gains? Not this trader.
LUCK, BS, and whatever else,
BDR
SLV trade ideas


Short SLVIt looks like a distribution, after the Monday rally we see it got sold hard and I don't think is going up anytime soon.

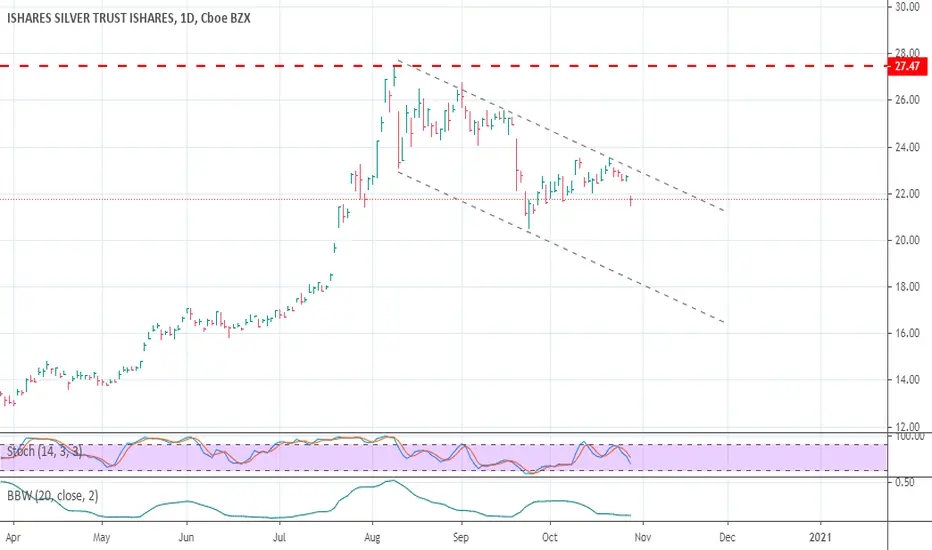
SlV in the month of Oct and NovAMEX:SLV has been super volatile however I have noticed a trend with this precious metal. When it is priced at or higher than $23 it tends to turn down pretty rapidly and the same goes for pricing at 21.95 in the opposite direction. While it is hard to gauge the exact demand/supply of SLV and market conditions CCI shows clearly overbought and oversold conditions of during the break of these levels. This month there has been extremely high volume at 22.50 and this seems to be a great level to watch for pullbacks or rallies on silver. As it sits on this level awaiting more developing news on the dollar's performance and future in the coming weeks, I remain bullish on SLV. My target is 24.20 Before taking a position I would like to either see a pullback to touching or approaching it's supply zone at 21.95 or a valid break and retest of 22.69. Trailing stops is a viable option for this volatile choice.


Silver and the Election Silver has historically thrived under Democratic presidents, and I think this will be no different this time around if (or when) Biden wins. SLV seemed to recover the last 2 days of this week on riding the trendline that's been dating back to March of this year.
I'm going to be watching 24.25 as resistance this week with possible upside of 25.50's in the short term run. I am long on SLV and hoping we can see similar levels we saw in 2012 - at the 35's.

SLV finally cleared key pivotAfter a fake breakdown SLV has recovered and cleared my buy point of 23.50.
As I have posted numerous times, precious metals are very are to trade as they are
manipulated and jump around a lot. Best for buy and hold trades. I see the recent
price action as bullish. Strength above 23.50 is positive.
See previous post.

SLV January 2021 range forecast $29.92 - $32.17Silver is in two metal categories. It is considered a precious metal used in jewelry and coins. And it's an industrial metal because it is the best thermal & electrical conductor ideal for electronic technology devices. Yesterday, on November 5th, The Federal Reserve voted to keep short-term borrowing rates anchored in a range between 0%-0.25%. Economic activity remains “well below” levels prior to the coronavirus pandemic, the Fed’s post-meeting statement said. Fed officials have been vocal about the need for more fiscal and possibly additional monetary support. With technology demand rising and inflation forecast rising, silver is well positioned for gaining value into the future. Do your own due diligence, your risk is 100% your responsibility. Good luck and happy trading friends...
*3x lucky 7s of trading 101*
7pt Trading compass:
Price action
Volume average
Trend momentum
Current events
Revenue & Earnings
Debt / Cash
Book value
7 Common mistakes:
FOMO
+5% portfolio trades
Bad risk management
Emotions & Opinions
Lack of planning & discipline
Forgetting restraint
Repetitive errors
7 Important tools:
Trading View app
Accurate indicators & settings
Wide screen monitor/s
Trading log (pencil & graph paper)
Big organized desk
Reading books
Brokerage UI
Checkout my indicators:
Fibonacci VIP - volume
Fibonacci MA7 - price
www.tradingview.com

#SLV Almost Ready for the Continuation#SLV Setting up a bullish pennant on weekly and daily time frames. High volume run ups are usually followed by a period of consolidation before a continuation/reversal. Once silver breaks above the upper trendline and clears 23.55, SLV should start its move to $30+ by the end of the year. This is just the start for silver and gold and if it isn't a part of your portfolio yet, I'd strongly consider it. Do your own due diligence as always.

Bullish Flag patternI am thinking about buying some Bull call spread on SLV.
Before doing it, I will wait for a clear sign, such as a breakout or higher lows.

SLVLooking for the 50% retrace from low to high. Looks like a giant bull flag. Considering $19-20 range SLV, spot Silver ~$20.80

Bull Flag on SLV Weekly ChartBull Flag on SLV Weekly Chart I expect a move higher from here within a few weeks.


SLV - Could Get UglyPerceived channel looks like it might be worthwhile to buy a couple of puts to take advantage of this potential.
Preserve cash in case we do get down to 16. Chances are that physicals might not be available at those low prices. If they are, How I'd love to buy physicals for under $20! Those were the good old days. But maybe we will see it again.
SLV - it's coming!SLV working on the next leg up! Little more consolidation here. Indicators looking good! Resistance ready to give way. Wait for it!

SLV Monthly channel and Election year seasonality
SLV price pattern resembles year 2012 election year more it looks like.
All SLV seasonality regardless of election,
Recent 5 years 2015-2019:
Oct/Nov/Dec 0.8/-5.1/2.3
Recent 7 years 2013-2019:
Oct/Nov/Dec 0.0/-5.5/1.5
Recent 10 years 2010-2019:
Oct/Nov/Dec 2.2/-2.6/-0.5
Recent 2 previous election years
2016: Oct/Nov/Dec -6.8/-7.7/-3.5
2012 Oct/Nov/Dec -6.6/3.2/-9.2
Disclaimer, this is only for entertainment and education purposes and doesn't serve by any means as a buy or sell recommendation.
Personally I hold both long term long positions and occasionally short term short position, for disclosure purpose.

SLV to jump highSLV to climb higher and higher. We are in an upswing and it should continue for a while.

SLV into election With the election and fear and intelligence both approaching, smart money will pull out of markets or transfer it into Silver or Gold, two symbolic gestures. With some options activity scanning, these are my predicted lines on Silver.


SLV on watchSLV still on watch. See previous post. Silver an gold catching a bid in the overnight session so we'll see where
it opens tomorrow. I like it above the box for move into dotted line targets.
