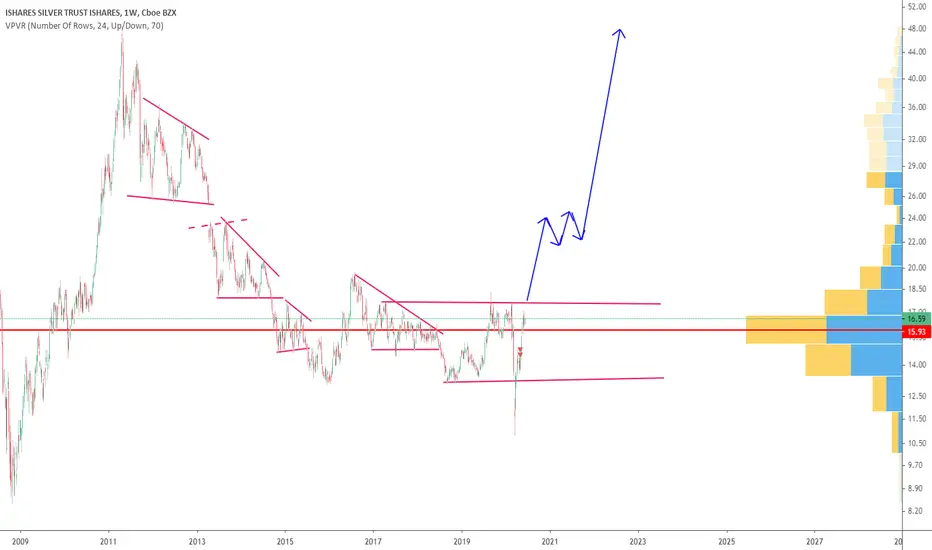
SLV - Wait for it!SLV looks to me like it's headed to the promised land. RSI divergence. Gold/silver ratio needing to normalize while gold marks time. Bull flag break coming. Wait for it!
SLV trade ideas

Head & Shoulders on Silver (SLV)Looks like a pretty clear head & shoulders pattern on Silver, confirmation was a broken bottom.
Going short.
This is not trading advice, just an observation.


SLV for BearsThis could happen to SLV in a bearish scenario if dollar rises for some reason
Follow
Follow
Follow

SLV Weekly ThoughtsLooking ahead, not certain where we are in the Wave formation. Did we just complete a wave 1 of a new bull phase? Or a Wave B of a correction? Only time will tell. We can see the two previous tops. My automatic expectation going forward is something similar to the yellow circle where we see what has been a typical three week testing of the high. The closing high was tested three weeks later and then the following bar illustrated a testing of the three week inter-week high before reversing.
We see a similar setup in this past week where we made an inter-week higher high but closed lower. The next week was down and I anticipate that the next week will also be down, followed by a rally the following week to test the closing high. Then if we meander sideways, could be a wave 2 of a new impulse move higher. In this setup, I see prices perhaps dropping to the 10 week average around 15, which is also a .328 retracement of the entire move up. This would then be followed in coming weeks by an up move running to 16.66 to 17 and change. Failure there would result in lower prices.
The blue circle shows something different featuring a Key Reversal setup. This does not reflect last week's price action. We can see how that played out, rather badly. While I had early on expecting that another wave down to the 10-12 level might be possible, I can also see that we might have already gone through a well defined A-B-C correction with the A and C tops defined in the circles. If we are still in a corrective mode, we might see a dramatic selloff, erasing much of the big gains we saw from the lows.
I have a number of short calls set for June 19th and 26 in anticipation of a June monthly test of the low. Not too much of the traditional stuff that I have used for decades appears to be working anymore. But thinking that we are due for PMs to get crunched again, I am at the ready. Not always right but I don't mind playing with the "paper." It's like playing Monopoly to me. The real worth is in the physicals.
My cycle review of stocks shows that while we are at the highest levels of momentum and overbought I have ever seen, it appears that the markets will continue higher. I would expect PMs to take that queue and continue selling off. That will be good as I had exited WPM, AG, FNV and other PM-related stocks a bit early and would like to pick a spot to reenter. But we still remain very overbought on these issues so it could be a while before they are again in buy areas. Who knows anymore? Markets continue to astound on unreal fiscal stimulus. Another $ trillion is expected to boost the markets.
With that in mind, it’s good to continue stacking as supply comes available. Hopefully the premiums will simmer down some. I continue to buy physicals even at the higher prices as I want to convert the fiat as much as possible. Does it really matter what price you pay when considering that the fiat has no value? As more and more money is created, it can only continue to be devalued, whether this is reflected in the current market prices or not, it is still the reality. Enjoy your weekend.

SLV & GLD performance in the 2008 Financial Crisis Do advice. Am a novice with no charting experience. This chart is only used for looking at performance in 2008


big gap at 25 on silverAg needs to break through 21 and then fill the gap otherwise it will just stay in same old trading channel. may back down to 10 or 12

SLV and other random thoughtsLooks like a little higher yet for SLV. Here are my humble (and often wrong) thoughts on what might occur in markets for the next month. assetdesigncenter.blogspot.com Feel free to comment here or on my blog. Thanks. Have a nice weekend. Stay safe.

SLV - Plata BullishAsí veo la plata. Continuando al alza. (Ojalá :p) /That’s the way I see Silver (slv)..

SLV long term bullishTrade #5 of this month
Support level at $15.2 and next target $17 and $19.2. Yes it got a bit overbought lately but similar to gold, silver is gonna survive and it already up 50% in just 2 months.

SLV - is the bear market over?Not yet! But a decisive break of the long-term overhead resistance (orange line), which dates back to the start of the bear market in 2012, and a pause at 17.45 impulse FIB and overhead resistance (redline) before it does break thru would be very constructive. By then SLV should be sufficiently overbought and enter a period of consolidation that may not give up much price action. Silver miners still fighting and leading the way.

Gold is running ahead of Silver and that means, silver has to play catch up.
Both gold and silver have nicely broken out of the wedge/triangle pattern and are slated to go higher.
You can see from Chart that Gold has gone up way ahead of Silver , leaving a wide margin for Silver to play catch up. At current price, I think it is still cheap and it has a good long term bullish chance to rise higher.


SILVER: potential bearish ABCD pattern. Retrace almost DONE!SILVER: potential bearish ABCD pattern. Retrace almost DONE!
Define stops according to your risk profile.

SLV - Second Guiding View for Next WeekThe 40-period moving average is one that I often refer to for longer term guidance. Looking at how SLV has reacted to the 40-week moving average over time gives some additional input as to how I will position myself next week. Not sure if the strong buying momentum will continue into next week's opening or if option expiration activity was a key factor. If anyone out there watches the expiring option open interest levels to make price predictions, please chime in.
Seems like in most cases, price has shot through the 40-week average but has then served as a magnet to pull prices back down to either ride this average or break away. So using this, along with a previous shorter-term channel view in the last post, I'm thinking of selling some May 22 $16 puts, especially if we open a bit weaker. Seems that price can run perhaps up to 17 - 18 over the next few weeks and still be in a B move of a corrective phase with another move down later. I've seen some projections of prices breaking under $10. I'm targeting 12.5 or thereabouts but must say that my calls haven't been so spot on recently.
My Excel data on the daily basis shows strong upside momentum in all the cycle indicators so I want to sell puts to continue taking in premium on the weekly basis. First was thinking that the 15.5 level is where the 40-week average comes in and that would be a seemingly easy short put position. But seeing how price generally overshoots that line on it's first attempt through makes me think that the $16 put is worth the risk. If I'm dead wrong on this, I sold June 19 $12 calls yesterday so I would only be moderating any profits I would accrue on the downside.
For the bullish side, I have lots of Jan 21 LEAP spreads ranging from $16 to $20 offset by $25 calls, some outright Jan 22 calls and the physicals. Those positions don't get touched as I'm long term bullish. The long term goal is a Mike Maloney prediction, that 1,000 ounces will buy one a nice home when prices reset. I'm shooting for a beach front condo in Mexico! Que Bueno, no?

SLV - Strong Day - Channel FormingSilver easily pushed through expected resistance levels. This channel shows a good 10% move could happen pretty quickly. Still thinking it could be a B wave in a correction with lower prices yet to come. But this chart setup looks positive. While Stochastics are on the overbought side, the BBW indicator is starting to increase showing me that momentum is building.
Keep on stacking . . .


BREAKTHROUGH The iShares Silver Trust (the 'Trust') seeks to reflect generally the performance of the price of silver.Silver exchange-traded funds (ETFs) closely track the price of silver and are generally more liquid than owning the precious metal itself. Like other precious metals, silver ETFs are favored by investors seeking a hedge against inflation or a safe haven in times of market turmoil. Their Stock chart value said to bullish $15.3. Silver now a days potentially in demand This market is just so fantastic.Wanna Know More About Bullish Strategy READ MORE:

SLV - Finally at Golden Pocket FIBHopefully this is the push that finally gets SLV back to where it was pre-virus. Dips being bought and miners giving us some hope. As a long time fave character of mine would say....Giddy up!

