SILVER EXPLOSION !! I've had an affinity to silver for many years.
For last batch of years, I've been watching and waiting for any real sustained interest in it wanting to stay above $17.12 on the SLV chart...
This last thrust is convincing. I marked a zone of $17.12 - $17.80 for great time to load up for what could be the biggest SILVER EXPLOSION in our lifetime.
Many factors here, but I'll point out the double bottom on monthly chart, with MACD divergence.
We saw volume really pick up in 2019.
Also, the RSI is at resistance, which once broken can see swift massive gains.
As you can see from the indicators during the last bubble, the bulk of the silver move happened when they were overbought.
Lastly, trading altcoins has been and will be a nice prep to navigate this SILVER EXPLOSION.
Ill add a few more supporting charts soon, like the rising wedge in the gold/silver ratio, and the bullish possibility in gold too.
Much like bitcoin, don't lose your position in the shakeouts along the way, just to buy back in FOMO areas.
UIOGD - JMJ
Travis
SLV trade ideas

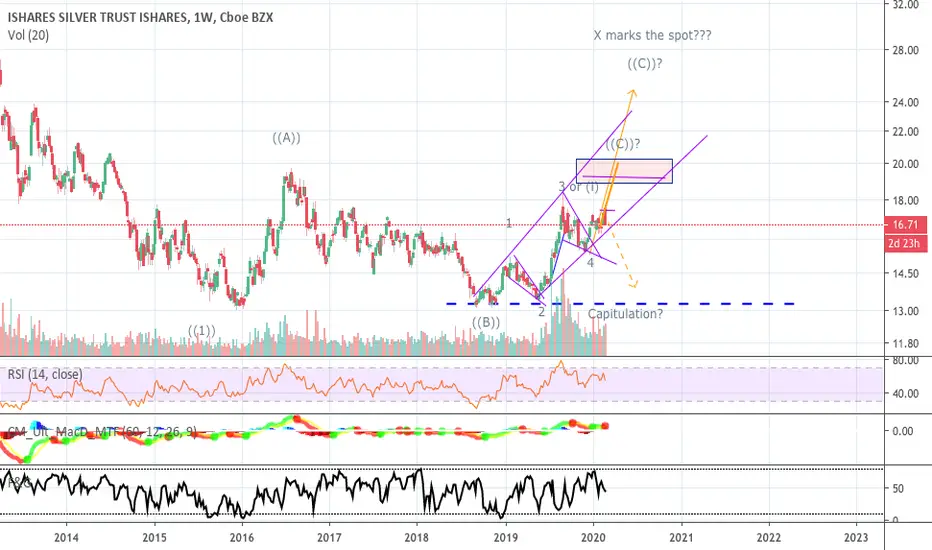
Pirate adventure continues OR end of all adventures?Been a while mates! Hope y'all doing well! As my followers know, I've been targeting the X (SLV to hit 25) for nearly a year now. A couple weeks ago, it almost seemed like winds were starting to take us in that direction action. However, we have now been given a powerful warning shot with the deep red candles, synchronized with the 3 day stock market collapse. I have cut back on my silver positions.
The adventure could still continue...
However... if gold and silver collapse along with the stock market, then all market adventures could come to a grinding halt, and we need to be prepared for this possibility. It would mean the worst thing possible...
Era of deflation.
iShares Silver Trust Pulls Back to Old ResistanceThe coronavirus selloff has hammered almost every corner of the market, aside from precious metals. Most attention has focused on gold and gold miners . But silver has also been on the move.
Each share of iShares Silver Trust controls one ounce of the white metal. It jumped above recent resistance in the $17 - $17.20 area last week, only to pull back and test the same price zone today. That level can now be useful for risk management.
The longer-term chart of silver is extremely volatile, although one thing is clear: It's historically inexpensive relative to gold. TradeStation data shows that the gold/silver ratio is now around 90 times, near the high of the century. Generally, silver lags gold early in the cycle and then outperforms as investors pile into precious metals. Will that older pattern return?
Finally, traders may want to remember why gold just hit new 52-week highs. The cause is not only risk aversion but also low interest rates from global central banks. That was true before the outbreak and now coronavirus only adds to the situation.


Pay attentionBetter pay attention here to what SLV is doing. Daily candle is rather bullish and watch the DMI moving up!


SLV - Fib Target ProjectionsReviewing Fib ratios shows expectations for coming moves. SLV retraced it's last up move right to the 50% level. Having found support here, one would expect it to rally to the -.23 fib at 17.63. If SLV corrects 50% from there, it can be expected to fall to 16.97. Support there would indicate another move to the -.23 fib at 17.94. Beyond these targets, there is nothing constraining price to stop at these levels. Price can continue beyond depending on strength/weakness. With the added interest rising up in the precious metals sector, the likelihood of prices reacting to Fibonacci levels increases as many computer algos use them for action points.

SLV Must Take Out 19.69While reaching above 19 would be quite an accomplishment for us long-suffering Silver fans, breaking above that last peak would confirm the double bottom forming, predicting much higher prices.
Does appear that we are starting the long awaited fifth wave of this move. In commodities, the fifth wave is often the longest.
Gold is still leading though. Silver somehow needs to find it's own legs and knock that goldsilver ratio back down to realistic levels.

SLV - Reverse Head and ShouldersWill another rush to PMs push SLV through the neckline and off to the $19 level? Should be a wave 5 move unfolding, expecting large moves soon. Even though we've most often seen big slam downs when reaching resistance, I'm not willing to give up any of my position.


Bullish LongtermSilver is having a hard time with all the decent earnings reports and greed overwhelming wall street.
Longterm however, silver is posed to outperform, and continue performing.
Gotta find me some miners with good dividends.
Suggestions appreciated. :)

SLV - Can Copper's Basebuilding in 1999-2001 Show Silver's Path?
Copper had a long term double bottom similar to what silver. Copper took some time to work through the base and eventually test the previous high and then explode. Interesting to see the interaction of copper price versus the 50 and 250 day EMAs. The crossover of the 50 and 250 also was a key sign of strength. Silver seems to be on a similar path, offering significant upside, if copper's past actions are any clue.


SLV - It's Not as Bad as You ThinkMany lament as gold continues to forge ahead, apparently soon to hit the highs, while silver seems to languish, continuing to get smacked down over and over again. A weekly look comparison however shows that Silver has pretty much tracked gold over time and is poised to break out to the upside.
Again, patience continues to be required as the potential for more sideways action is possible. The weekly line chart shows the possibility of a reverse head and shoulders pattern that can drag this out for yet another month or so before the next leg up. There is no telling on this though. I've been long over the past few years and it seems that whenever I want to throw in the towel and sell some of my paper silver, it shoots up the next day.
I have to keep reminding myself that selling at 17 or 18 is not why I am accumulating a position both in the paper products, mining and streamer shares, and physicals. The very long term channel shows prices hitting 70s and some suggest even 100 or better.
As one commentator on YouTube suggested, it only takes one company producing solar panels or some other product that depends on silver saying that production has slowed due to their inability to get enough silver. At that point, our only risk is that the government confiscates our silver due to National Security concerns. Hope not.

SLV - Post-Slam down ProjectionsMust admit that these regular-occurring slamdowns is even starting to affect me. I had previously been conditioned to "buy" but this has continued on for years now and I stepped back from buying more. Perhaps this can indicate that in general, the bulls are giving up. I suppose that is why I like to frequently buy the physical silver and gold. I look at that a bit differently than the ETF trades.
That being said, technically, SLV has only retraced back to the 50% Fibonacci level from its last major top. In David Halsey's Trading the Measured Move book, this is the level when the algorithms come in to buy. The target is the -.236 mark. If this plays out, the projected channel shows that this target should hit by mid-April.

SLV Continuing ConsolidationThe Head and Shoulders look continues and the measurement shows that a move to around 16.16 is in the cards. Seems like silver is always in a correction/consolidation phase. Quite the opposite feel that we have in stocks where any little dip is immediately bought. Bought some puts when I posted the head and shoulders item. But remain very long both physicals and LEAPs.

A Pirate Adventure: Bull Flag Breakout ContinuationAhoy mates! Let us prepare for perhaps the greatest part of this pirate adventure. The battle against all headwinds seems near an end and our treasure is once again in sight! Time to raise our sails!
TA: Seems like we just muddled through a period of consolidation after breaking out of the bull flag a few weeks ago. Friday, SLV started rising with great RSI strength which is a sign that a much stronger rally lies ahead. Time to hop on but stay cautious to any sudden reversal. Once we are through the previous high, sailing *should* be fairly smooth, at least to the 19.x level.
Good luck mates!

Silver Short SqueezeAfter several years of accumulation, the up move begins with a stop hunt out of the triangle to get everyone short and to stop out weak longs. Now that the weak longs are out of the picture, most of the long positions are in the hands of the strong players who are holding for the big move up. Shorts will be forced to cover once this bull flag completes by the end of the month, adding more buying pressure to breakout of any resistance levels.

SLVs Next MoveSilver analysts are divided on where the Wave count is. Some suggest that we are in a B wave correction to a longer term move down. Others suggest that we are in a wave 5 of a bullish move. I side with this interpretation. If correct, it appears that we may be completing a minor wave 2 of the expected 5 wave move up. As mentioned several times, wave 5 moves in commodities often are the strongest while in most other instruments, wave 3 tends to be the longest.
Usually, according to Elliott Wave theory, either wave 3 or wave 5 extends. In the major wave 3, we do not see any extensions so it's possible that this major wave 5 may be explosive.
Fundamentally, silver supply and demand numbers indicate annual shortages while production numbers continue to decline annually. When looking at the longer term performance of silver versus gold, gold has retraced close to 618% of its decline from the major peak in 2011 while silver struggles to even get to the .236% fib level. The gold/silver ratio reaches toward 90 even though some silver producers report that they are pulling out gold and silver at an 8:1 ratio.
There is no doubt that there are major price dislocations in all of the markets as interest rates remain historically low and the federal reserve continues to inject liquidity, pushing up risk assets ever higher. While silver has not participated in this general rise, a historical price review shows that silver has made major bottoms consistent with stock market bottoms. Silver's major low in 2008 coincides with the low point of the last Recession.
So the bottom line is this, if this is a B wave with a major C wave down to come, don't expect to find a safe haven in stocks. It may in fact be an indicator that the economy is heading in to a recession. WIth the economy currently firing on all cylinders with Trump keeping the pedal to the metal, I'm not seeing any sign of recession. So while the market timing may be distorted, I continue to buy physicals for the very long term and use LEAP options to juice my portfolio. While my long term target based on channels suggest 70s, others suggest that silver can move above $100/ounce. With such a small market, should funds decide to take even small positions in silver, demand will greatly overwhelm supply. Only time well tell if this scenario plays out but there is no denying that silver is undervalued especially when compared to other investment assets (including junk bonds).

SLV Looking for 16.55Consolidation wave in play here with a target of 16.55. Whether this is a complete wave 2 correction or Wave A of an A-B-C correction, is unknown. I'll plan to buy some shorter term duration calls, perhaps March, at 16.55.

SLV - Progress ReportSLV has completed a five wave up move. As my overall price objective for the main move is at least 19.58, it's my assumption that this was just a larger wave 1. A wave 2 may have already completed with a .382% retracement. There do appear to be 3 waves signifying a corrective wave. Or a larger A-B-C correction might take price down to the 50% fib level of 16.33.
I had previously bought Jan 2020 15-17 call spreads and on the rally, sold off the 15 calls, leaving me short the 17s. One more week is left until January expiration. These short calls closed at 0.13 indicating that the market expects SLV to rise to 17.13 next week.
Strong relationships have been noted with stocks rallying and silver and bonds falling, and vice versa. Could be that stocks have completed a major five wave move up and may begin a corrective wave. IF the correlations continue to hold, one can expect strength in precious metals and bonds.

