SLV trade ideas

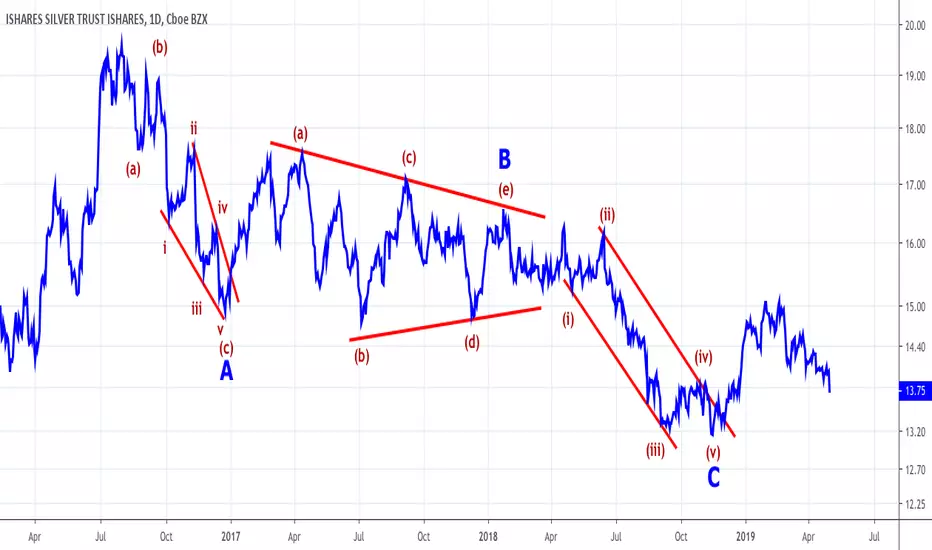
SLVFeel free to scroll through some of my older Elliot wave counts of Bitcoin, and you'll notice that SLV's count is about as similar as it gets! I'll be curious to see if the pattern continues!
$SLV I see a bounce coming from this lower tight wedge.Have shares of this, imo in order to gain good momentum, needs to bounce above the $15 mark.

watching for silver break outconsolidating well. watching for price break out of the wedge. two entry options with 16 target $SILJ $SHNY $GLD

SLV NEEDS TO MOVE COMING WEEKS
Two important trend lines intersecting, expecting some large volatility in coming weeks


SILVER Big Bullish Move Likely Coming SLV 2019!SILVER has a high probability of exploding in price. At this current level around $14 SLV , it is very possible that price could go 2x 3x or even more. Here's why...
Double Bottom on Weekly chart
Double Bottom on Monthly chart
Bullish Breakout of channel from August 2018 - daily and short term
Bullish divergence on Weekly
I was watching this channel on SLV which has been in effect since August 2018. In it is featured a double bottom . Especially when looking as a weekly time frame, this double bottom is accompanied by divergence in the indicators and this level is ALSO a monthly support, which also looks like a double bottom from 2015!. This is all very strong long term.
Once the price finally broke out of the channel as it did today (seen on the weekly and smaller time frames), serious consideration needs to be paid as to when to enter.
It is very possible that we see a correction in the overall market very soon.. either a bullish pop, or at least a pause in the violent sell off... And for that, I'm going to wait and watch SLV. I think a pull back (a retest) of SLV could coincide with a rebound of stocks. This would make perfect sense as for example, SPY might want to bounce to test all the supports is just blew through, and SLV might want to do one final consolidation before blast off.
That last part is just my thought as to how it might play out.. But the main thing is, whether entering now or in a month or so, chances are good for a BIG Bullish move in Silver into 2019 and beyond.
Travis
JMJ - UIOGD

SLVslv : wait for some corrective structure and bang in this will go higher my target is 15-.50-16 and above

$SLV weekly chart w/important levels for the silver ETFSilver appears to be headed back toward its major support at $13.00, from where it will likely bounce and continue in its current consolidation pattern...until it doesn't. Currently trading at $14.09.


SLV Support TestHolding 14.69 today (Wednesday's close) may lead to an explosive breakout in the next two weeks

Silver : Negative Interest Rates, QE4, End of PetrodollarAll long-looking indicators point to silver being undervalued vs gold . Top chart shows silver candlesticks vs gold red line as percentage returns since 2006 in the case of these investment trusts. Middle indicator is the Trader's Dynamic Index ( TDI ) which holds a combination of moving average, volatility and momentum trends. Bottom indicator is the infamous Gold:Silver ratio.
Silver is sitting on top of the .382 fib level support shown in the chart, which is where the current cost of production resides around $14.75/oz. Low risk, high reward - this is a perfect setup for those interested in making an inflation play going toward negative rates, QE4 and the end of the petrodollar agreement.
% Returns Analysis: Silver below Gold -> Silver undervalued
Fibonacci Level: Strong support at cost of production near $14.75/oz
TDI: Bullish divergence in formation
Gold/Silver ratio: 83:1 -> Silver undervalued
Note: SLV is not equivalent to owning physical silver. Trade SLV at the risk of fund insolvency and loss of investment - most holdings are suggested to be physical.

Silver to $5.00/oz by Dec 2020 - let's hope so!!!Monthly Model suggests major low in precious metals is years away - Dec 2020
brschultz / markettimer777

SLV Resistance Right Where We ExpectedThe Fed''s decision to "pause" rate hikes justified the current levels for silver. That may have marked a short term top (SELL THE NEWS) as price touched the top of the lower sloping channel. The monthly chart shows that the recent monthly test of the closing low failed. While prices rallied despite closing lower in November (testing the August closing low), I am expecting another stab at that November closing low. A close above that level at the end of Feb signals a successful test of the low and a good chance for higher prices. A gap up above the channel line changes everything!

SLV and the Powell PutWill the Fed's pause (ending) of rate increases boost SLV above 15.50? Good spot to buy puts, just in case.

SLV rejects to 500 Double Hull : Target $13.75Each Time SLV collapses... it falls back to at least 500 Double Hull

SLV Daily Price vs 340 Day SMA...Rejected like me in High SchoolSLV has been rejected by the 340 Day SMA almost as many times as me in high school by the ladies.
brschultz


SLV Island BottomPer Bulkowski:
Important Bull Market Results for Island Reversals
Overall performance rank for up/down breakouts (1 is best): Not ranked
Break even failure rate for up/down breakouts: 31%; 32%
Average rise/decline: 32%; 13%
Throwback/pullback rate: 54%; 55%
Percentage meeting price target for up/down breakouts: 79%; 60%
32% up would get us close to 20

SLV Breakout? or Fakeout?Fast move to top of current range. Stochastics turning up and the parabolic indicator implies the start of a move higher. For Elliott Wave,, could be a wave 5 of 3 of 1. Any EW experts here? If follow through on heavy volume comes in, some gaps above 15 and 16 need to be filled

SLV oversold and retesting previous supportstoch big time oversold, price broke above previous support, now re-testing
long for me with a stop at 14.20
