rising wedge semiconductor longshort semiconductors are on the verge of breaking down, and basically if we stay over 12.20 soxl im aiming for daily gap close, or near 12.86 . if we break this ascending tightening range to the downside and more or less double top 4hr resisting from top of envelope, around 12.30s or lower, im looking toward 15 minutes demand zone in low 11s maybe 11.30. short squeeze in semiconductors, or failed bull breakout. even if longs win, im selling rallies on the daily by buying soxs on dips to weekly lows, or new weekly lows (keeping in mind the s&p can still resist from 4000 or slightly higher/nvda can sell off $160, 162.5, 165).
SOXL trade ideas

4 hourly charts4 hourly charts 4 hourly charts 4 hourly charts 4 hourly charts 4 hourly charts 4 hourly charts

short term bullishness in semiconductors lower lowthis bounce in tech is kicking off the morning, but its not rocketing to new highs, and in this macro environment im not changing from bear bias totale. i will consider 4hr longs taking profit into pivot or upper smart money concepts profile area resistance. remember to reenter short on bear momo.

SOXL | Semiconductor Bull 3x ETF | LongThe fund invests at least 80% of its net assets (plus borrowing for investment purposes) in financial instruments, such as swap agreements, securities of the index, and ETFs that track the index and other financial instruments that provide daily leveraged exposure to the index or to ETFs that track the index. The index is a rules-based, modified float-adjusted market capitalization-weighted index that tracks the performance of the thirty largest U.S. listed semiconductor companies. The fund is non-diversified.

long SOXL 11.90Look daily stoch heading down we can pull back some
know look at the weekly stoch heading up so any sell off will be small

$SOXL looking good. can we see 0.6 fib SOXL was supported by a support line with rising lows and started an uptrend.

semiconductors daily bounce or continued downsidewe are at the low end of top anchored vwap. if we get over this pivot and support meaningfully we could see a test of sss moving average or signal around upper horizontal and gap close. if we remain beneath and resist with sss signal and qqe staying red id look for that lower horizontal.

Not the buy point yet!!!First off, please note that this is not a good investment instrument. The leverage, and management fee, and volatility are just not for value investment. You need to buy it at the absolute low to profit. Anyone to buy this EFT need to be very cautious.
Secondly, using an options strategy may help, but the liquidity is a big concern. You pretty much see a loss at the moment you execute an order.
Well, after the BAD news from AMD, we will probably see more downside in the semiconductor sector. Will it dip and lower than the 2020 March low? Maybe. Although I do hold some hope that that case won't happen but who knows?
My best bet is that the low will be somewhere between $4.5 and $5 if you are looking for a long-term holding of this EFT.
For short-term, it will do it usually thing jump up-and-down between $8 and $12.
So here is my strategy
Buy 01/17/2025 $9 PUT & Sell 10/21/2022 $8 PUT (Diagonal Put Spread)
Buy 100 Shares @ $9.2 & Sell 10/21/2022 $11C Call (Covered Call)
Buy 10/21/2022 $10/$12 Debit Call Spread.
For the total price $920 (stock) + $350 (option contracts) = $2190
Expect profit/loss is somewhere between -$100 (if -15%) and $350(if +30%). The loss may be reduced with the "Roll" strategy, i.e. the short PUT needs to be rolled lower and later if the stock price hit $8.0. This strategy reduces the risk and maintains the profitability. I hope you will like it.

SOXL retracement tradeSOXL retracement trade to start off the week. Week will probably turn extreme bullish around tuesday / wednesday. This is a quick scalp in the first hour of monday. Playing with puts.

wow. chips are cheap even with all these dollars.the semiconductor industry stocks are so far outside of what is fair value to the downside that by december 2023 its just a guarantee that we will be back up to the tope of monthly envelope.

This will 20x from here within 5 yearsrecord buying volume all last week. will gap back into the channel. gaps at $10 and mid 13 range. gaps much higher to follow

dead cat bounce possible, but in a clear downtrend 🩸many better setups for longs out there IMO, looks like this one wont break downtrend anytime soon.
upside to 9-10 before next leg down is possible
SOXL might be overextended & blowing off soon; not yet but soonMonths ago, SOXL came into the radar, and as it broke out, it also failed along with the rest of the markets. There were many clear opportunities on both sides.
SOXL has more than halved its value since its last high. Is it over extended to the downside - yet?
Short of the lack of a higher low, and being way ahead of the curve, SOXL appears to be having a bullish divergence in both the Weekly and Daily charts. Notwithstanding, it is still in a deep downtrend. Just look at the Friday candle, it is a clear and present Dark Cloud Cover, which suggest more downside to follow.
Targeting the next and possibly last downside target is 5.60.
And then it might be time to watch for the price movement to realign to the bullish divergence, if it does when it reaches at that time.
But for now, it is just a heads up...
Stand by!

SOXL - Buy Update SOXL - BUY - Completing 18 Month Long Correction
This is in WEEKLY LOG mode for reference
A brutal 18 month long correction nearing completion.
I will be looking for a bullish fractal to emerge soon.
Notice huge volume....capitulation.
Stay tuned...
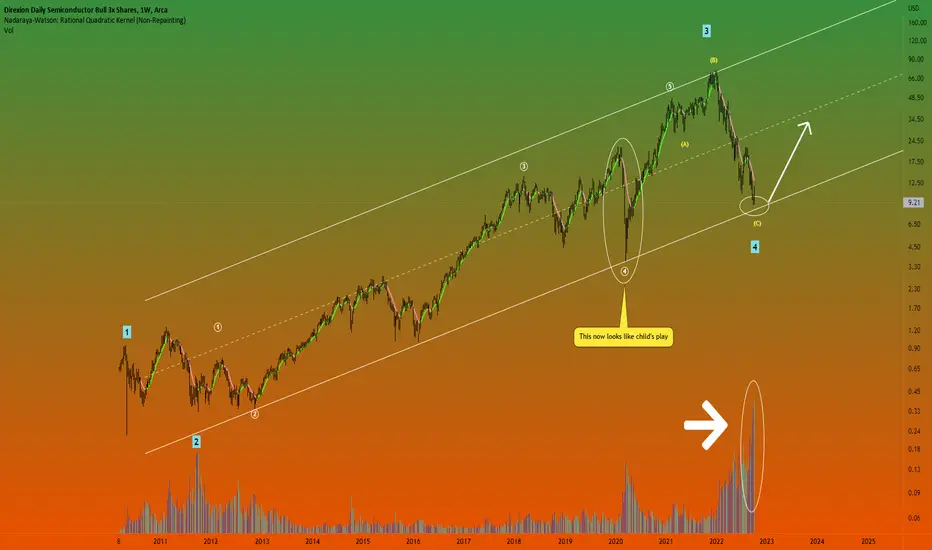
The world no longer needs chips! LOLThis is in my opinion like buying oil stocks in the march 2020 crash. Semis to technology is like oil to transport. The world will not survive without either. So I place my long here today confidently regardless of the next few weeks or months. I will hold this until we re-reach our previous ATH which will be sooner than most anticipate. I expect by 2025 this will rereach those highs and achieve a much higher value by 2030. This is a serious chance to change your wealth status. Buy red sale green as always this is not financial advice. Do not be short-sided with this dip. Get in front of big money. Retail is gone from the markets, now all that is left is big money to choose their picks... high probability this bounces soon major.

$SOXL Possible 12.50 TESTSOXL is holding the Oct VWAP and currently above 5DMA, looking for a test of 12.50 before Friday. If we have market support this move should be relatively easy. Let me know your thought below!

SOXL / SMH - CREATING A BULLISH REVERSALBACKGROUND:
SOXL (3x ETF) created a great reversal pattern back in JUNE - JULY 2022. It's tempting to ignore it because it ultimately failed on 8/26/22. Nonetheless, it was a great technical entry point when the price broke above $17.
CURRENT PRICE ACTION:
The reason I'm pointing out what happened in JUNE - JULY is because SOXL ETF is forming another BULLISH reversal (early stage) having just passed above last Friday's (9/30) high and entering back into the $9.50 - $10.50 range. The two previous reversals (8/26, 9/13) had failed. Yet the job of a trader is to not HOPE or PREDICT, but rather TRADE the signals and MANAGE RISK ACCORDINGLY .
GAMEPLAN:
I'm watching if the price closes above $10.35 (approx.) within the next few days. I'm anticipating some price action around this level. Any close above $10.35 can follow with some pullback. In fact this is a GREAT entry point for the bears if we were to follow trend alone. However, the reversal that happened from $9.50 and the bounce that's happening on the NASDAQ (potential double bottom) can signal a potential reversal in the market (short-term).
There are two potential bullish reversal scenarios:
1. Straight up(rare)
2. Chop sideways and build a larger reversal base (as happened in JUNE - JULY)
LOOK-OUT FOR:
What comes out of the FED emergency meeting. As mentioned in my previous post on the status of the DOW JONES - I think the analysts at the FED see the same. The FED will either blink and change its' stance or the market is taking another big leg down...
Be safe all and thank you for reading.

MOMENTUM SHORT ON SOXL Due to the rise in bearishness, I predict $SOXL will get to the below support lvl at 6.77.

I know all the FUB but RSI do not lie. Soxl has never crossed below 30 rsi according...to the RSI 1 Day Chart.
To me this looks like a signal. To be very cautious about puts right now and keep an open mind to a big reversal due to being officially oversold. ALSO the SPY has crossed Below 30 on the RSI which is more oversold than it was at the June lows bottom before turning around. So keep an eye on this. And regardless of the FUD...remeber before any bottom bottoms out and the next day is a rally you STILL here all the same amount of FUD and negative sentiment all over the place...its called click bait alot of it is at least..to attract attention to get views ect... stick to the technicals..

SOXL - all three hitsMid-week update on SOXL and observation that a bounce was about to happen, was expected with these criteria for something worth a look at:
" The current gap range needs to be closed clearer and an immediate resistance (above yesterday's high, green horizontal line) needs to be cleared. Then a break into the next gap range above the next resistance (thicker green line) is essential. "
So, the weekly chart is now indicative of a likely bounce given the bullish candlesticks Piercing Pattern . Technical indicators do not quite tell it... yet.
The daily chart did almost what it needed to do.
1. It closed the late August gap (down);
2. It cleared the immediate resistance (green line); and
3. it broke into the next upper gap range by gapping over the next (thicker green line) resistance.
Technical indicators crossed over or are about to cross over.
Bullish, as all outlined criteria is accomplished.
Now, it probably come back to test a resistance-turned-support. Hint here is that despite the bullishness, it still failed to clear out of the current gap zone. So, the resistance there is strong and perhaps another day it will break out.
So, expecting a shallow retrace, and then take off.
Meanwhile, a possible higher low on the weekly chart just might have been registered.
Be nimble, be quick... be like Jack!

Is it time to SOXL again?Hardly excited after a pretty decent bullish bounce in the SPY, SOXL similarly bounced, although it appears to be lagging somewhat. Is it premature, or is it bouncing?
The SOXL daily chart shows the downside target just hit at about 12, at the beginning of September. Two days later a higher low was registered (this is clearer in the hourly chart). The bullish candle yesterday appears to suggest a possible trend change bounce; but risk management (especially for a leveraged ETF like this) prompts for more confirmation and better odds. Some boundaries are needed...
The current gap range needs to be closed clearer and an immediate resistance (above yesterday's high, green horizontal line) needs to be cleared. Then a break into the next gap range above the next resistance (thicker green line) is essential. In fact, a higher high would be much appreciated. These sound like a tall order, but it is opined to be necessary. Particularly since the daily technical indicators have not yet crossed over, so the downdraft might not yet be over.
Having said that, the red support line below the last (higher) low must be maintained. If broken down, price should easily go below 11. The breakdown probability is rather significant currently, although going below 11 is not yet a major risk.
Conclusion... potentially a bounce, perhaps equal probability to be at the start of some sort of consolidation zone, or less likely a pause to dip much further down.
Watch closely, be ready and nimble...

Soxl Very large pattern here. At the suppor area ow getting a small bounce off hourly. This is a level to watch. I think we hold here. This could be a great entry poin. Keep stops below trend suppor of 12ish. Or close if we close candle bodies below uptrending support. Good luck

Soxl Strong support forming at 12.15 area. Upper reistance of symetrical triNgle is 19$. Breaking that level and closing above could target us 30$ We got a bounce so far, wouldn’t surprise me to roll and retest the symetrical triangle support once or twice more so be mindful of that support. Overall it could be consildation before a nice big move up but still needs more time to creat the pressure between the range
If by chance we lose 12$ I’d be targeting 10$ zone as second support
