SOXS is a play I love hereDiverging this while NVDA simply cannot live up to expectations. NASDAQ:NVDA
SOXS trade ideas

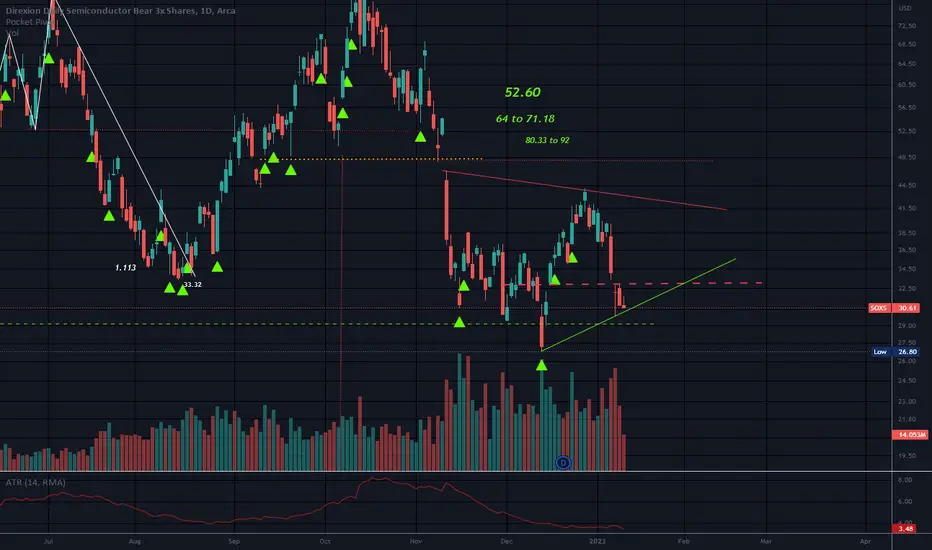
Bearish outlook for semi's - SOXSAMEX:SOXS is trying to tell us that it's time to hedge our semi positions. I'm looking for a full candle close over 13.92 for final confirmation and to anchor my fib time zone from the summer lows

INVERSE H&SLEVERAGED.
Price has broken the neckline.
Target 1 has been met.
Resistance overhead.
No recommendation.
Direxion Shares ETF Trust - Direxion Daily Semiconductor Bear 3X Shares is an exchange traded fund launched by Direxion Investments. It is managed by Rafferty Asset Management, LLC. It invests in public equity markets of the United States. It invests through derivatives and through other funds in stocks of companies operating across information technology, semiconductors and semiconductor equipment sectors. It employs short strategy and uses derivatives such as futures, swaps to create its portfolio. The fund invests in growth and value stocks of companies across diversified market capitalization. The fund seeks to track -3x the daily performance of the PHLX Semiconductor Sector Index. Direxion Shares ETF Trust - Direxion Daily Semiconductor Bear 3X Shares was formed on March 11, 2010 and is domiciled in the United States.
The investment seeks daily investment results, before fees and expenses, of 300% of the inverse (or opposite) of the daily performance of the ICE Semiconductor Index. The fund invests at least 80% of its net assets (plus borrowing for investment purposes) in swap agreements, futures contracts, short positions or other financial instruments that provide inverse (opposite) or short daily exposure to the index or to ETFs that track the index. The index is a rules-based, modified float-adjusted market capitalization-weighted index that tracks the performance of the thirty largest U.S. listed semiconductor companies. The fund is non-diversified. Benchmark: ICE Semiconductor TR USD

SOXS Stock Chart Fibonacci Analysis 101923 Trading Idea
1) Find a FIBO slingshot
2) Check FIBO 61.80% level
3) Entry Point > 11/61.80%
Chart time frame : B
A) 15 min(1W-3M)
B) 1 hr(3M-6M)
C) 4 hr(6M-1year)
D) 1 day(1-3years)
Stock progress : A
A) Keep rising over 61.80% resistance
B) 61.80% resistance
C) Hit the bottom
D) Hit the top
Stocks rise as they rise from support and fall from resistance. Our goal is to find a low support point and enter. It can be referred to as buying at the pullback point. The pullback point can be found with a Fibonacci extension of 61.80%. This is a step to find entry level. 1) Find a triangle (Fibonacci Speed Fan Line) that connects the high (resistance) and low (support) points of the stock in progress, where it is continuously expressed as a Slingshot, 2) and create a Fibonacci extension level for the first rising wave from the start point of slingshot pattern.
When the current price goes over 61.80% level , that can be a good entry point, especially if the SMA 100 and 200 curves are gathered together at 61.80%, it is a very good entry point.
As a great help, tradingview provide these Fibonacci speed fan lines and extension levels with ease. So if you use the Fibonacci fan line, the extension level, and the SMA 100/200 curve well, you can find an entry point for the stock market. At least you have to enter at this low point to avoid trading failure, and if you are skilled at entering this low point, with fibonacci6180 technique, your reading skill to chart will be greatly improved.
If you want to do day trading, please set the time frame to 5 minutes or 15 minutes, and you will see many of the low point of rising stocks.
If want to prefer long term range trading, you can set the time frame to 1 hr or 1 day.

RECTANGLELeveraged x 3.
Horizontal trading channel which is also a consolidation pattern.
The top is resistance. The bottom line is support.
This pattern is neutral until broken.
Goldman Sachs FS Treasury Intms Instl
41.43%
Ice Semiconductor Index Swap
31.30%
Goldman Sachs Fin Gov 465 Institut
13.11%
No recommendation.

Change of games, bears are in control ! PT 16After a huge run we are ready for a healty pullback. Here it shows a confirmation of the breakout out and I believe semi sector is flthe first sector to correct therefore its meaningfull to go long SoXS !
All the best!

SOXS potential breakoutpotential breakout to the upside. just a though- cause it would be just so easy to blame AI

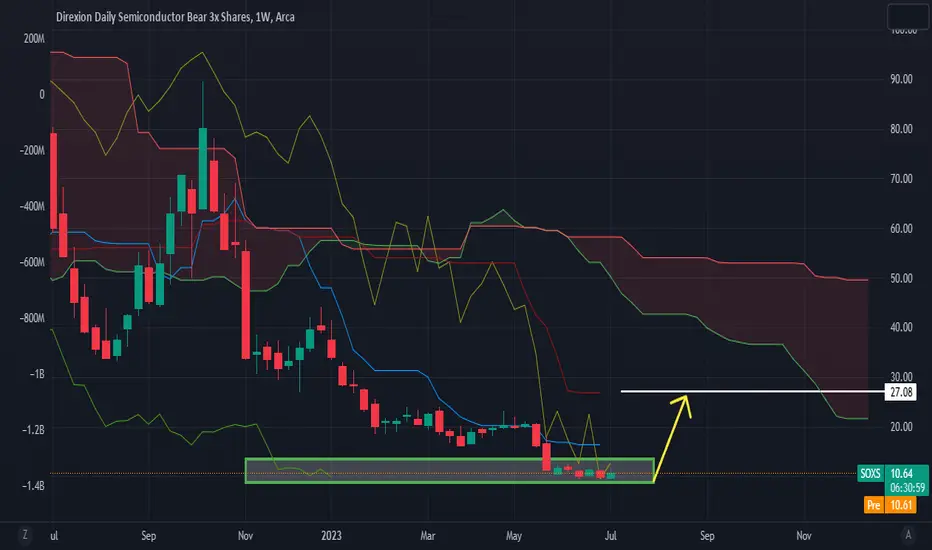
triple bottom on the weekly target $27looking at the weekly chart, I spotted a triple bottom by AD/ PA/ Chikou... my long term target is $27
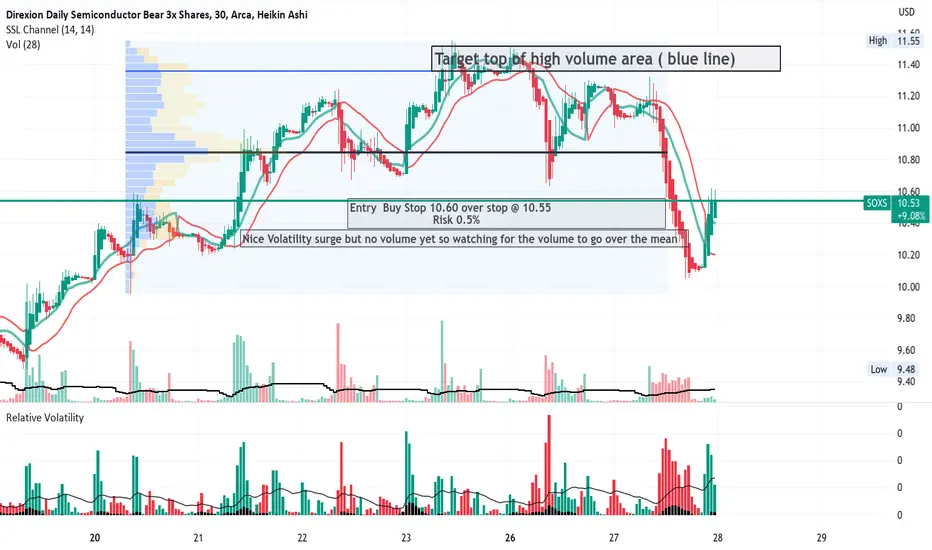
SOXS Bearish Leveraged semi-conductors ETFNVDA turned down today while SOXS rose a bit. On the 30 minute chart is shown to have
have been trending down but then reversed in the after-hours trading period albeit with
the low volumes typical of after-hours. The relative volatility indicator however showed
a dramatic reversal and will be beyond the moving average within the indicator.
Overall, I see this as a day trade for June 27th. I have marked out a tight stop loss to minimize
risk. This trade which I will enter in the premarket is expectant for 8-9% profit and so
a reward to risk of 15:1
Long SOXS 11.11SOXS sitting on support 10.13
daily stoch pointing down I am early
Stop 10.03
Target 18.00 and higher in time

SOXS Stock Chart Fibonacci Analysis 051623Trading Idea
1) Find a FIBO slingshot
2) Check FIBO 61.80% level
3) Entry Point > 19.3/61.80%

A possible scenario for SOXS, short term vs long term!On April 3rd, I published this:
Stop loss updated to entry after 10% profit:
Primary target reached in 22 days:
Now we have another possibility and we should manage accordingly!

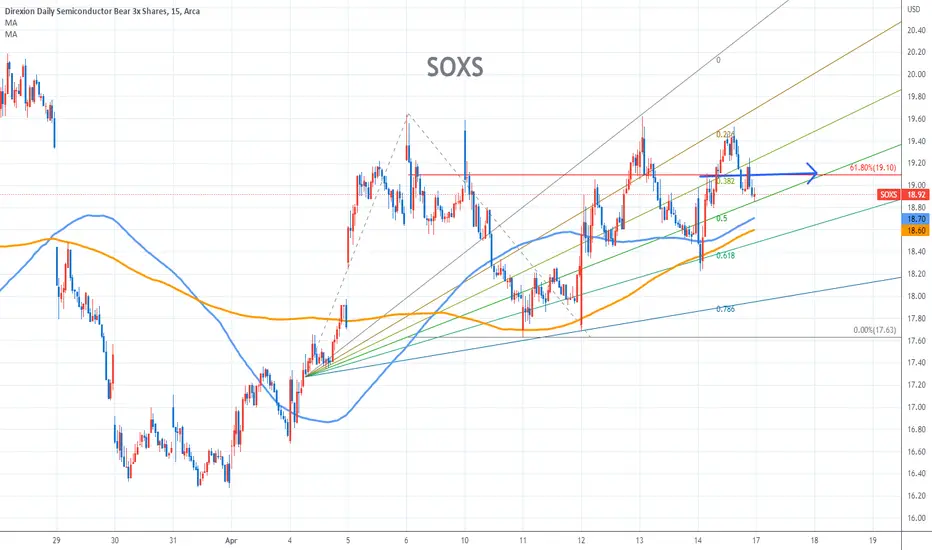
SOXS Stock Chart Fibonacci Analysis 041823 Trading Idea
1) Find a FIBO slingshot
2) Check FIBO 61.80% level
3) Entry Point > 19/61.80%

SOXS Stock Chart Fibonacci Analysis 041523Trading Idea
1) Find a FIBO slingshot
2) Check FIBO 61.80% level
3) Entry Point > 19.1/61.80%
i will long from this price targets no leverage no stop losei will long from this price targets no leverage no stop lose

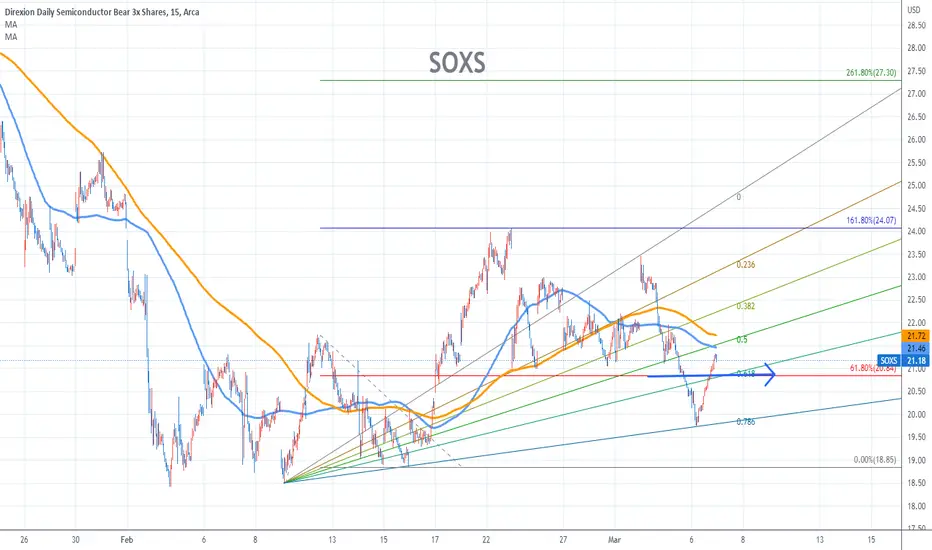
SOXS Stock Chart Fibonacci Analysis 0306231) Find a FIBO Slingshot
2) Check FIBO 61.80% level
3) Entry Point > 20.8/61.80%
Bottom FishingAll time low.
Hard to believe considering the market is basically in an overall downtrend.
Risky due to lack of support underneath other than 18.41 so if one were to chance it, a stop underneath this low may or may not work depending.
Leveraged and will move when semiconductors stop moving up.
No recommendation.
Direxion Shares ETF Trust - Direxion Daily Semiconductor Bear 3X Shares is an exchange traded fund launched by Direxion Investments. It is managed by Rafferty Asset Management, LLC. It invests in public equity markets of the United States. It invests through derivatives and through other funds in stocks of companies operating across information technology, semiconductors and semiconductor equipment sectors. It employs short strategy and uses derivatives such as futures, swaps to create its portfolio. The fund invests in growth and value stocks of companies across diversified market capitalization. The fund seeks to track -3x the daily performance of the PHLX Semiconductor Sector Index. Direxion Shares ETF Trust - Direxion Daily Semiconductor Bear 3X Shares was formed on March 11, 2010 and is domiciled in the United States.
The investment seeks daily investment results, before fees and expenses, of 300% of the inverse (or opposite) of the daily performance of the ICE Semiconductor Index. The fund invests in swap agreements, futures contracts, short positions or other financial instruments that, in combination, provide inverse (opposite) or short leveraged exposure to the index equal to at least 80% of the fund's net assets (plus borrowing for investment purposes). The index is a rules-based, modified float-adjusted market capitalization-weighted index that tracks the performance of the thirty largest U.S. listed semiconductor companies. The fund is non-diversified. Benchmark: ICE Semiconductor TR USD

geez. long semis much?its been a hell of a couple weeks for the semiconductor stocks. weve blown through resistance with a vengence, and pretty much havent stopped for anything. the problem is the rest of the stock market hasnt responded with the same bullishness. just like i was in soxl coming off the top of the channel, im now in soxs coming off the bottom of the channel.

SOXS Descending WedgeMonitor for a breakout of the descending wedge. An impulse to the $33 range should follow with a bullish breakout.
(I am watching 1H MA50 also).
Good Luck


Symmetrical TriangleNeutral pattern.
If you wish to go long, maybe place a stop below bottom trendline and vice versa.
No recommendation/Price is at support. Possible inverted hammer.
this thing is about to smash the market into little tiny piecesarent we all glad we reinvested early in semiconductors? i sure am. the short semiconductor etf is going completely insane. expect that to continue. if you look at the 5 minute you can see we are poised for breakout. we will probably go outside upper envelope, swing back to value area low before moving higher. i dont see anything thats going to stop the total collapse of the semiconductor industry as we know it, do you?

