SOXS Channel, 4th Bounce? SOXS is getting ready where, 3 other times this year, has bounced to great gains all above $62, double move.
Watch for reaction in the next few days.
SOXS trade ideas

it looks like semiconductors are busti imagine this down move in semiconductors is going to push mich lower, and soxs is a long at these levels into the upper 70s. the signal moving average is green on this inverse.

$SOXS 3 peaks Domed HouseSuch a great specimen combining an entire market cycle into one chart.
3 peaks Domed House - Distribution / Reaccumulation / Upthrust double top
The entire market cycle also forms a nice Bullish cypher before the return up to where we are now.
Clear accumulation beneath our inflection zone, adam & eve style double bottom
BTC finished this 3 peaks domed house pattern in November and Spy did on the Weekly back in the 2000s before one of the greatest bull markets in history.
For comparison, BTC would now be in the reaccumulation phase under the Basement zone (last july was our basement)
I posted a chart representing this pattern in December, and it played out quite nicely

Time to take profits from SOXSTop of keltner channel(overbought)
Bearish divergence on 5 and 15min
lower volume today
Now above volume profile large block
powell speaking tommorow
high risk low reward to hold

Bullish SharkBullish Alternate Shark and the 4th leg ended at the 1.113 versus the .886.
No recommendation.
Best to buy on UP market days.
Leveraged x 3.
Fees can be high and not intended for a long term hold.

SOXS at support for LONG SWING SETUPAMEX:SOXS
Reports are the semiconductor secotr is presently challenged with rising costs
and lower production orders.
SOXS is in a flat bottom triangle with price now at its base.
The RSI Oscillator is in mid-range suggesting price has upside.
The relative volume has been increased in the past two weeks.
I see this as a swing long setup with the target 30-40& above
the current market price in the mid-Fibonacci retracement range.

SHORT SEMICONDUCTORS ON NEWS- SOXSAMEX:SOXS
Semiconductors have been giving some cautious guidance suggesting a market downturn,
supply chain issues and the recession fears. Vehcicles are being shipped to dealers lacking
some "chips" ; in the meanwhile, the CHIP acts hopes to stabilize things.
SOXS a ETF shorting the semiconductor industry #X leverage as the inverse of SOXL
The 4H chart of SOXS shows an EMA ribbon divergence, a market low with a Double or
Triple Bottom and an Asymmetrical Inverse Head and Shoulders with a neckline trendline
Marking a breakout just above the current market price.
This appears to be a good swing long trade setup or call option entry ripe for the taking.

Short term trend for SOXS landing into Sep 23, 2022.Short term trend for SOXS landing into Sep 23, 2022.

SOXS to SOXL ratio DAILY CHARTAMEX:SOXL
This chart strives to setup a trading plan where the SOXS and SOXL
are oscillated. They are 3X leveraged ETFs with great range.
SOXS was up 400% YTD at its peak. The new CHIPS
ACT is a catalyst for US semiconductor manufactures
Right now the ratio is on a downtrend, meaning Sell SOXS
or BUY SOXL or a combination of each.
I believe that this strategy could yield 5X annually
to investors or long-term swing traders with little effort
especially if an alert is employed to notify the ratio
is changing trend direction at a pivot.
The timeframe could be lower but then the number
of trades is likely to increase as is the amount
of profit. This could be backtested by those
familiar with the mechanics of doing so.

Direction daily on the uptake. SOXSWe are not in the business of getting every prediction right, no one ever does and that is not the aim of the game. The Fibonacci targets are highlighted in green with invalidation in red. Fibonacci goals, it is prudent to suggest, are nothing more than mere fractally evident and therefore statistically likely levels that the market will go to. Having said that, the market will always do what it wants and always has a mind of its own. Therefore, none of this is financial advice, so do your own research and rely only on your own analysis. Trading is a true one man sport. Good luck out there and stay safe

Pull Back FishingPSQ/QQQ, FAZ/Financials, SOXS/Semiconductors, NAIL/short homebuilding, TZA/small caps, and the list goes on and on for every sector. These are leveraged and short an index.
It is not the same really as going short and you do not have to borrow shares from your broker. These, plus more are ETNs. There are also reciprocals that go long an index that are leveraged. IE FAS is long financials.
Anything leveraged is risky as they move 2-3 times the market movement that day.
Just something I have been looking at until out market turns around and of course it is best to buy a short ETN on an up day for the market, although we have no had a whole lot of these. All of these are very close to their bottom.
Most do not hold these long term.
No recommendation
Exchange-traded notes (ETNs) are types of unsecured debt securities that track an underlying index of securities and trade on a major exchange like a stock. ETNs are similar to bonds but do not have interest payments. Instead, the prices of ETNs fluctuate like stocks.
www.proshares.com

RectangleThis is leveraged and volatile. This will go down three times the up move if we have a good market day for semiconductors.
Getting in at a good price is paramount.
Price has broken the upper trendline for now. There is also a double bottom.
Price is not quite overbought with RSI on 80 versus 70.
Price is over the top Bollinger bands.
No recommendation
Golden cross as the 50 is crossing up through the 200.
3 year high is 8040.00

SOXS: I know people say you cant chart itI think it may be a great time to short semi conductors. I am in some calls for the next week and a half lets see. I believe this can gain momentum, key support is around 4$

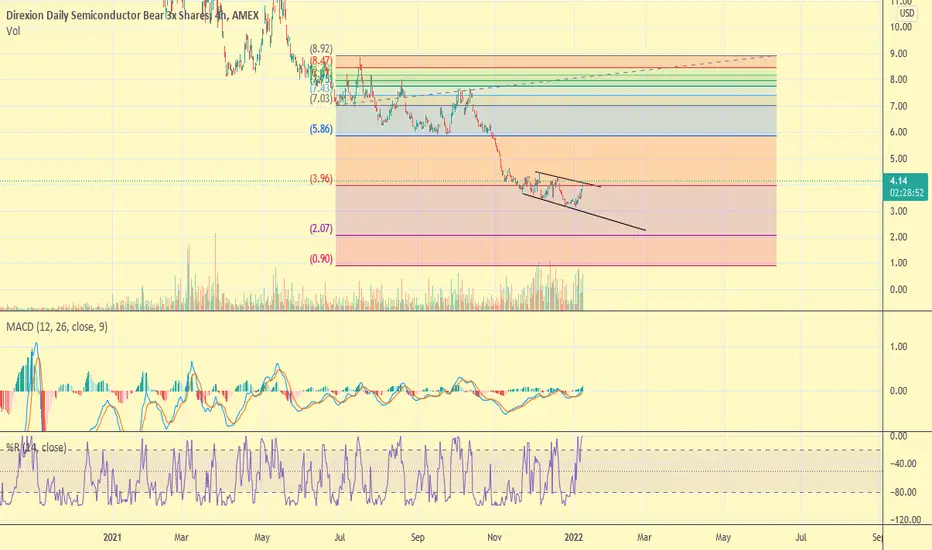
Semis about to take a hitThe Semiconductor sector has been on a tear for the last year and I don't think they are exempt from what is about to happen in the markets. I am playing SOXS to try to increase my exposure to the down side. SOXS has broken out of the descending channel and I am looking for a move back the 1.618 fib retracement at $5.86. My options play is ITM $4 CALLS for Feb. 4 exp
Not Financial Advice
If you like Sushi you need to read this!Betting against the market has increased significantly!
In the past 2-4 weeks the volume of the 4 inverse ETFs has increased significantly (+2x)!
This means lower prices are more likely!
What could happen in the next 3 weeks if prices pass the Red lines?
Market Reversals and the Sushi Roll Technique:
In his book "The Logical Trader," Mark Fisher discusses techniques for identifying potential market tops and bottoms.
Capturing trending movements in a stock or other type of asset can be lucrative. However, getting caught in a reversal is what most traders who pursue trendings stock fear. A reversal is anytime the trend direction of a stock or other type of asset changes. Being able to spot the potential of a reversal signals to a trader that they should consider exiting their trade when conditions no longer look favorable. Reversal signals can also be used to trigger new trades, since the reversal may cause a new trend to start.
One technique that Fisher discusses is called the "sushi roll." While it has nothing to do with food..!
The "sushi roll" is a technical pattern that can be used as an early warning system to identify potential changes in the market direction of a stock.
When the sushi roll pattern emerges in a downtrend, it alerts traders to a potential opportunity to buy a short position, or get out of a short position.
When the sushi roll pattern emerges in an uptrend, it alerts traders to a potential opportunity to sell a long position, or buy a short position.
A test was conducted using the sushi roll reversal method versus a traditional buy-and-hold strategy in executing trades on the Nasdaq Composite during a 14-year period; sushi roll reversal method returns were 29.31%, while buy-and-hold returned 10.66%.
Sushi Roll Reversal Pattern
Fisher defines the sushi roll reversal pattern as a period of 10 bars in which the first five (inside bars) are confined within a narrow range of highs and lows and the second five (outside bars) engulf the first five with both a higher high and lower low.3 The pattern is similar to a bearish or bullish engulfing pattern, except that instead of a pattern of two single bars, it is composed of multiple bars.
Best,
Moshkelgosha
DISCLAIMER
I’m not a certified financial planner/advisor, a certified financial analyst, an economist, a CPA, an accountant, or a lawyer. I’m not a finance professional through formal education. The contents on this site are for informational purposes only and do not constitute financial, accounting, or legal advice. I can’t promise that the information shared on my posts is appropriate for you or anyone else. By using this site, you agree to hold me harmless from any ramifications, financial or otherwise, that occur to you as a result of acting on information found on this site.
Reference Article:
www.investopedia.com

SOXS: Semiconductor HedgeThe stocks are starting to fall and I think SOXS is poised for a rally once traders begin hedging considering the enormous gains made in the sector this year. 4 CALL 12/17 is what I'm looking at

Buy $SOXS - NRPicks 12 NovSeeks daily investment results, before fees and expenses, of 300% of the inverse of the daily performance of the PhLX Semiconductor Sector Index. The index measures the performance of domestic companies engaged in the design, distribution, manufacture and sale of semiconductors.

Buy $SOXS - NRPicks 29 Oct$SOXS is an index that seeks daily investment results, before fees and expenses, of 300% of the inverse (or opposite) of the daily performance of the Semiconductor Sector Index.

Buy $SOXS - NRPicks 15 Oct$SOXS is an index that seeks daily investment results, before fees and expenses, of 300% of the inverse (or opposite) of the daily performance of the Semiconductor Sector Index.

Buy $SOXS - NRPicks 27 AgoThe ETF seeks daily investment results, before fees and expenses, of 300% of the inverse of the daily performance of the Phlx Semiconductor Sector Index which measures the performance of domestic companies engaged in the design, distribution, manufacture and sale of semiconductors.

Buy $SOXS - NRPicks 06 AgoThe ETF seeks daily investment results, before fees and expenses, of 300% of the inverse of the daily performance of the Phlx Semiconductor Sector Index which measures the performance of domestic companies engaged in the design, distribution, manufacture and sale of semiconductors.
BUY $SOXS - NRPicks Jul 05The investment seeks daily investment results, before fees and expenses, of 300% of the inverse (or opposite) of the daily performance of the PHLX Semiconductor Sector Index. The fund, under normal circumstances, invests in swap agreements, futures contracts, short positions or other financial instruments that, in combination, provide inverse (opposite) or short leveraged exposure to the index equal to at least 80% of the fund's net assets (plus borrowing for investment purposes). The index measures the performance of domestic companies engaged in the design, distribution, manufacture and sale of semiconductors. The fund is non-diversified.

Buy $SOXS- NRPicks 04 JunThe Direxion Daily Semiconductor Bear 3x Shares $SOXS is an index that seeks a daily investment return, before fees and expenses, of 300% of the inverse (or opposite) of the daily return of the Semiconductor Industry Index.
In the last month there has been a lot of talk about semiconductors and their scarcity, a situation that had an impact on the price of some companies that had rallied and reached new all-time highs, however, the correction was not definitive.
Due to the current situation, where the production of chips and the performance of semiconductors in the short term is still in doubt, we point to a new correction that will benefit the SOXS and allow us to generate a good profitability.
MACD Level (12, 26) -864.17
RSI levels oversold
14% below daily MA50
