Soybeans and Corn are ready to goAMEX:SOYB and AMEX:CORN seem to be heading for big moves.
Not the most glamarous commodities but if one has leverage they can get a great risk to reward ratio.
Does anyone know how I can buy these commodities ?
SOYB trade ideas

Soybeans will take off with inflationI see a sharp ramp up in commodities after Powell's presser on Friday when the inflation metrics come out and he sends a Dovish message (not hawkish enough). The dollar will end up turning back up this summer so I see this upward trend momentarily until after the FED goes in with CBDC's and then commodities will take off. At that point I doubt stocks will exist so I would just caution you to buy freeze-dried food and some precious metals because a Global Depression is coming.

SOYB- the soybean ETF moves on buying pressure LONGOn the 4H Chart, SOYB has moved above both tthe near and intermediate term POC lines
of the respective volume profiles. Upward price volatility above the running mean
on the relative volatility indicator. In confluence pric emoved above the mean basis
band of the double Bollinger band. Fundamentally, supply-demand imbalances including
the collapse of the Black Sea shipping deal as bad actor Russia continues to inflict chaos
has a ripple effect throughout agricultural commodity markets. Soybean prices are
not following the chaos and volatility of the general markets like AMEX and NASDAQ but rather
they follow the beat of their own drum like seasonality crop yields shipping costs and
others. This make an alternative to avoid going heavy into topping or sinking general
markets. They allow diversification not unlike adding bonds to a portfolio when trying
to weather the storm. Given the narrow trading range I will play this with some call options
If you would like my idea of an excellent call option trade please leave a comment.
See also my ideas on WEAT and CORN.
se to expire after the harvest and into the planting in in Brazil.

$SOYB: Crops might get a popSoybeans looking particularly interesting, curious to see if NYSE:MOS and NYSE:CF are laying hints on an aggriculture bounce

Accumulating more of SOYBAs a consumer of TOFU (made from soybeans) for years, I am well aware of its health benefits and been an advocate of buying its ETF, futures for some years now.
What is exciting for 2021 is this chart here ! It has broke out of its long term bearish trend in Aug 2020. Well, while the price seems to move up pretty fast from 14 to 20+ dollars, there is still 8+ dollars potential before we see it revisiting its peak in Aug 2012.
We have cleared the first resistance at 15.93, second resistance at 18.97 convincingly. Now, let's wait for the pullback and see these beans soar higher.....

What is this Monstrosity!You know what is! Another Bullish Move
Reasoning
Whole Industry is moving!
Flat or XYZ Consolidation seems done
Correction is not overextended
Double bottom with second low undercutting the first
Several weeks of consolidation, seems like a huge move coming
Divergence on Composite Weekly Chart!!
My Would Be Trade Plan
Look for a good entry as it is overextended right now and get in a good ride!!. I am a newcomer to commodity moves but they are so strong when they move
Look for a leveraged ETF as this one moves slowly. That means that you need alot of shared for a good move. (I could not find any leveraged ETF!).
Main Sources of My Knowledge
Mark Minervini
Constance Brown
William O'neil
Speakers on Trader Lion Youtube
Adam Khoo
My Indicators
14 Period RSI.
9SMA and 45EMA Moving Averages added
Composite by Constance Brown
This is for catching failures in the RSI.
The RSI is a bounded indicator so sometimes fails to catch divergences. This indicator helps show that
Composite Settings
Author : Constance Brown (Connie Brown)
RSI Length : 14
RSI Momentum Length : 9
SMA Length : 3
Fast Simple Moving Average : 13
Slow Exponential Moving Average : 33

SOYB , LONG Trying some commodities plays going forward.
SOYB is one I took in the early aftermarket .. looks worth a shot to me . It's the second wedge drop/ wedge pop setup after the lockout, first was march 22 (note the WD that occurred) .
Entry here in AM at - 10.37
Stop - 26.99
De risk 28.07
Chart Legend
IBO = initial breakout
BO = Breakout
E = Entry I like

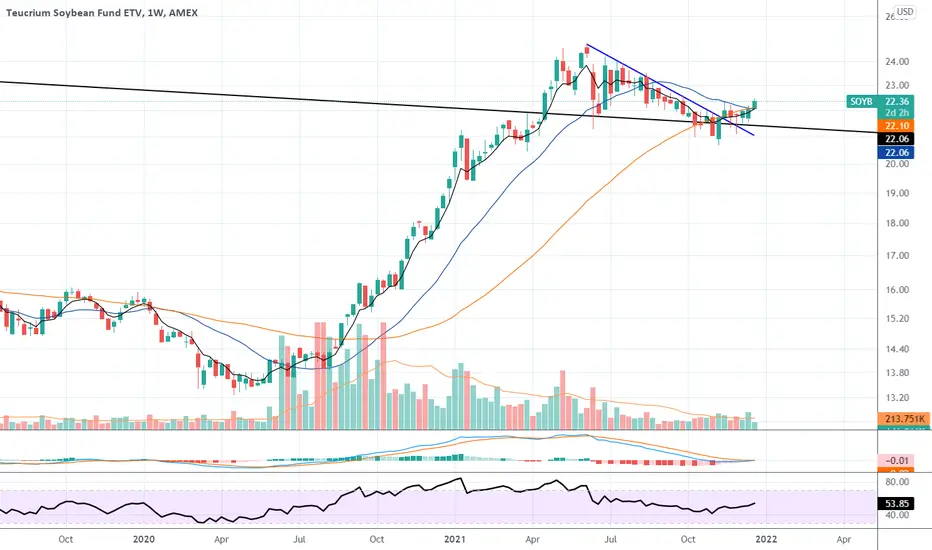
SOYB 2012 chart pattern being repeated.2012 chart pattern being repeated for the SOYB fund. Estimated 4-month holding period before another correction takes place. Taking a long position on the head of a potential head and shoulders pattern. The regression is 0.04 less (0.958 vs 0.914) than 2012 so made an adjustment to the estimated holding period from 3-month to 4-month. Placing stop loss at the 24.80 in case volatility increases. Price resistence level at 26.33 confirms expectations for further increase. Target profit price level at 28.88.
Risk Disclaimer
*Futures, stocks, exchange traded funds and spot currency trading have large potential rewards, but also large potential risk. You must be aware of the risks and be willing to accept them in order to invest in the futures, stocks, and forex markets.

Soybeans ripped! Approaching monthly resistanceTook profits on my SOYB position for some nice gains considering a lot of downside in the equities market.
On a monthly time frame, SOYB is approaching resistance zone so I took profits and will be watching to see how price reacts here.
I'm expecting retracement / consolidation here before continuation to the upside or back down from profit takers and sellers stepping in.
Alert set at $26.5
May also be setting up for a good short opportunity

Long SoybeansGoing long (commons) on SOYB
Agriculture looks bullish and I like the textbook breakout here. Also with equities wavering, SOYB DBA CORN agro charts appear more bullish to me IMO
Respect the stop loss and but give this trade idea time, she's not always the fastest mover

SOYBBroke out of the primary downtrend back in April. Consolidated a bit and now breaking out of the consolidation. Food prices probably going up (more) soon imo. Corn has a similar look.
SOYBEAN upward move play with Teucrium Soybean $SOYB trust fund
(1) Futures Technical Analysis
Bullish triangle with RSI breakout.
Enought space for bullish move.
s3.tradingview.com
(2) SOYB trust fund
I've skipped the futures instrument, because I'm not like options on futures.
My choice for Soybean play is $SOYB with relative high IVR value.
Optimal for Short Put Vertical strategy, similar TA here, with RSI pullback.
s3.tradingview.com
(3) Clear uptrend
Higher Lows Higher Highs.
s3.tradingview.com
CONCLUSION:
Max profit: $685
Probability of Profit: 55%
Profit Target relative to my Buying Power: 47%
Max loss with my risk management: ~$200
Req. Buy Power: $1320 (max loss without management at expiry, no way to let this happen!)
Tasty IVR: 66 (ultra high)
Expiry: 35 days
Buy 10 SOYB May21' 20 Put
Sell 10 SOYB May21' 22 Put
Credit Put spread for 0.685cr each, because IVR is relative high.
Stop/my risk management : Closing immediately if daily candle is closing BELOW the box, max loss in my calculations in this case could be 200$. Probability of loss in this way: ~25% . No stress above $21.1 level.
Take profit strategy: 65% of max.profit in this case with auto sell order at 0.27db. Probability of profit this way: ~75%.
Of course I'll not wait until expiry in any case!
If you liked this article, check my other ideas.
Anyway: HIT THE LIKE BUTTON BELOW , and for fresh option ideas FOLLOW ME( @mrAnonymCrypto ) on tradingview !

SOYBEENS CALL LOLwhy did i but soybeans??
well its the number one thing used in Vegan veg food like tofu and other things of such.
with the moment to the veg life i would only assume that the demand for soy would only go up:)
also wanted to diversify my portfolio more so i decided to buy this!!!


Potential Golden Cross ApproachingGood one to keep your eye on. Some fundamentals could add up to the price of soy going up soon, dollar intervention, potential trade war agreements, loss of pork in China, cold weather in the US that Dept of Agriculture has not updated the forecasts on yet. Certainly worth keeping an eye on!


Soybeans: 34 Day SMA presses 500 Hull and Up Up & AwaySoybeans: 34 Day SMA presses 500 Hull and Up Up & Away


SOYB - Soybean CornerHmmm....very interesting to me.
Price bounced at the L-MLH.
It produces what I call a corner.
And if I throw a fork on it, it fits the "edge".
Letting it come back and try to hop on to the long side.
P!

Teucrium Soybean Fund (SOYB) has seen modest inflows this year.Weekly net soybean sales were 1,609,900 MT, a 21% increase from last week and a 62% increase from the prior 10-week average. Increases were reported from China, Mexico, the Netherlands, Portugal, Vietnam, and South Korea.
finance.yahoo.com
seekingalpha.com
