Turtle Trader IndicatorSo apparently Trading View has now removed the ability to publish indicators as a free users.
So unfortunately I cannot publish this anymore.
This is a prototype indicator I wrote after finishing the book, "The Complete Turtle Traders".
I plan to update modify this with my own TVMV framework and ta
Key stats
About Direxion Daily S&P 500 Bear 3X
Home page
Inception date
Nov 5, 2008
Structure
Open-Ended Fund
Replication method
Synthetic
Dividend treatment
Distributes
Distribution tax treatment
Ordinary income
Income tax type
Capital Gains
Max ST capital gains rate
39.60%
Max LT capital gains rate
20.00%
Primary advisor
Rafferty Asset Management LLC
Distributor
Foreside Fund Services LLC
SPXS is an extremely aggressive bet against the S&P 500, promising to provide -300% of the index's return for a one-day period. The fund, like most geared inverse products, is designed to deliver its 3x inverse exposure to the S&P 500a cap-weighted basket of 500 of the largest firms in the USfor one trading day. Holding it for a period longer than that will introduce the effects of compounding, a dynamic that's increasingly pronounced as you add more leverage to the strategy. If the fund is held more than one day, your position will need to be adjusted daily to maintain the -3x multiple. Investors should be comfortable with not just the mechanics of the portfolio but the counterparty risk it takes on to get its exposure: SPXS holds swaps on the index to achieve its goals.
Related funds
Classification
What's in the fund
Exposure type
Cash
Bonds, Cash & Other100.00%
Cash100.00%
Top 10 holdings

Looks like time to take some profits!
This spy chart is looking a little bearish! Breaking out of that descending triangle! Correction is imminent and coming soon! I think we should buy some protection for our portfolio! I’m looking at the SPYS to buy after Santa rally next week or sooner. Just insurance wise.

Still Inflation + no one has jobs don't be fooled...I'll take a short in this environment, to much uncertainty and a lot of overvalued stocks out there...

SPXS- Bear is the new Bull?**Disclaimer**: This analysis provides an overview of the historical performance of SPXS and highlights potential trading strategies based on observed patterns and volatility. However, this is not financial advice, and past performance is not indicative of future results. Traders should consider bro

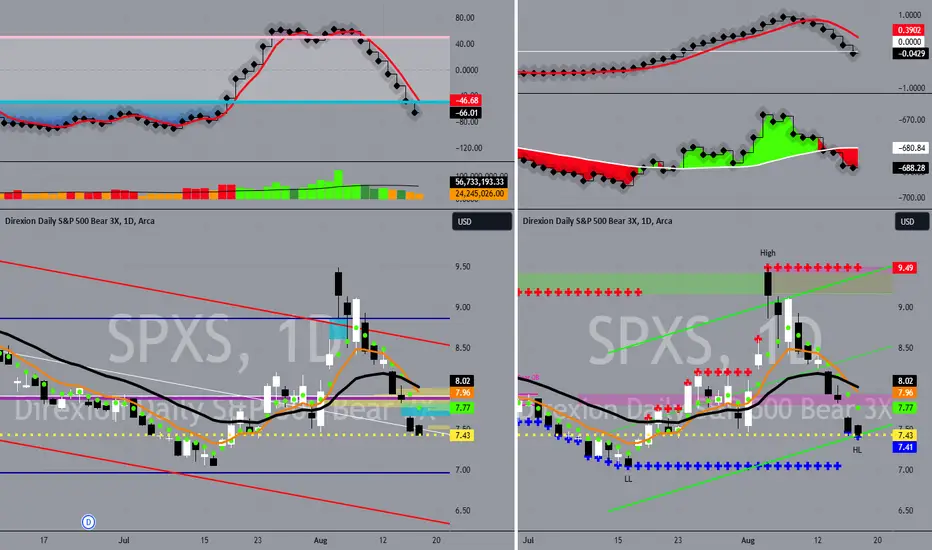
SPXS to $8 by 8/23Price at bottom channel
Stochastic Momentum Index (SMI) at oversold level
In at $7.43
Bought 8/23 $8c for $5
SPXSDivergence. Money!
When spy dumps, this should rise. Made a higher high on indicator, and higher low on chart.

SPXS callWhy:
1)This one is way oversold.
2)The indicators are at extremes not seen for a long time.
3)Bought April $6 call for $5.75, the premium was only 9 cents.

Bullish IdeaI feel this is a good play because I believe the market ( AMEX:SPY & SP:SPX ) to be in a correction phase of up to around 10% from its most recent weekly peak. I like the idea of AMEX:SPXS bear shares, not only because it behaves the opposite of SP:SPX , but because it's triple leveraged and yo

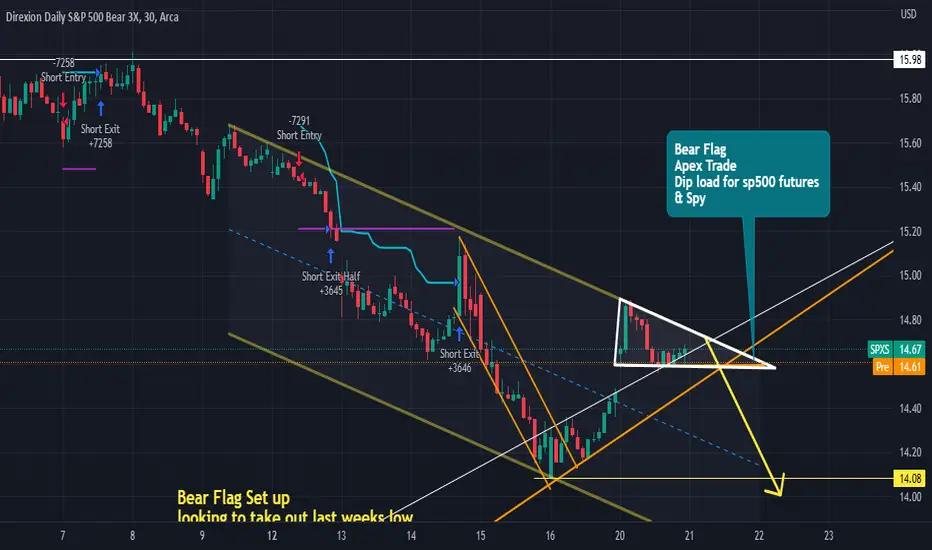
Bear Flag APEX TradeIf you follow my charts, you know I have targets for 4750 & 4900 for sp500 futures all have been confirmed w/ the AD showing Ascending Triangles to those targets. And the AD has also confirmed $475 & $493 for AMEX:SPY etf. I encourage bullish traders to bull all dips.
Another Tale is the Bear Fla
See all ideas
Summarizing what the indicators are suggesting.
Oscillators
Neutral
SellBuy
Strong sellStrong buy
Strong sellSellNeutralBuyStrong buy
Oscillators
Neutral
SellBuy
Strong sellStrong buy
Strong sellSellNeutralBuyStrong buy
Summary
Neutral
SellBuy
Strong sellStrong buy
Strong sellSellNeutralBuyStrong buy
Summary
Neutral
SellBuy
Strong sellStrong buy
Strong sellSellNeutralBuyStrong buy
Summary
Neutral
SellBuy
Strong sellStrong buy
Strong sellSellNeutralBuyStrong buy
Moving Averages
Neutral
SellBuy
Strong sellStrong buy
Strong sellSellNeutralBuyStrong buy
Moving Averages
Neutral
SellBuy
Strong sellStrong buy
Strong sellSellNeutralBuyStrong buy
Displays a symbol's price movements over previous years to identify recurring trends.
Frequently Asked Questions
An exchange-traded fund (ETF) is a collection of assets (stocks, bonds, commodities, etc.) that track an underlying index and can be bought on an exchange like individual stocks.
SPXS trades at 4.66 USD today, its price has risen 4.72% in the past 24 hours. Track more dynamics on SPXS price chart.
SPXS net asset value is 4.67 today — it's fallen 0.96% over the past month. NAV represents the total value of the fund's assets less liabilities and serves as a gauge of the fund's performance.
SPXS assets under management is 460.83 M USD. AUM is an important metric as it reflects the fund's size and can serve as a gauge of how successful the fund is in attracting investors, which, in its turn, can influence decision-making.
SPXS price has fallen by −1.27% over the last month, and its yearly performance shows a −38.28% decrease. See more dynamics on SPXS price chart.
NAV returns, another gauge of an ETF dynamics, have fallen by −0.96% over the last month, showed a −23.96% decrease in three-month performance and has decreased by −36.84% in a year.
NAV returns, another gauge of an ETF dynamics, have fallen by −0.96% over the last month, showed a −23.96% decrease in three-month performance and has decreased by −36.84% in a year.
SPXS fund flows account for 186.77 M USD (1 year). Many traders use this metric to get insight into investors' sentiment and evaluate whether it's time to buy or sell the fund.
Since ETFs work like an individual stock, they can be bought and sold on exchanges (e.g. NASDAQ, NYSE, EURONEXT). As it happens with stocks, you need to select a brokerage to access trading. Explore our list of available brokers to find the one to help execute your strategies. Don't forget to do your research before getting to trading. Explore ETFs metrics in our ETF screener to find a reliable opportunity.
SPXS invests in cash. See more details in our Analysis section.
SPXS expense ratio is 1.02%. It's an important metric for helping traders understand the fund's operating costs relative to assets and how expensive it would be to hold the fund.
SPXS is an inverse fund, meaning it's structured to generate returns opposite to the trends of the underlying index or assets.
In some ways, ETFs are safe investments, but in a broader sense, they're not safer than any other asset, so it's crucial to analyze a fund before investing. But if your research gives a vague answer, you can always refer to technical analysis.
Today, SPXS technical analysis shows the neutral rating and its 1-week rating is sell. Since market conditions are prone to changes, it's worth looking a bit further into the future — according to the 1-month rating SPXS shows the sell signal. See more of SPXS technicals for a more comprehensive analysis.
Today, SPXS technical analysis shows the neutral rating and its 1-week rating is sell. Since market conditions are prone to changes, it's worth looking a bit further into the future — according to the 1-month rating SPXS shows the sell signal. See more of SPXS technicals for a more comprehensive analysis.
Yes, SPXS pays dividends to its holders with the dividend yield of 5.66%.
SPXS trades at a premium (0.13%).
Premium/discount to NAV expresses the difference between the ETF’s price and its NAV value. A positive percentage indicates a premium, meaning the ETF trades at a higher price than the calculated NAV. Conversely, a negative percentage indicates a discount, suggesting the ETF trades at a lower price than NAV.
Premium/discount to NAV expresses the difference between the ETF’s price and its NAV value. A positive percentage indicates a premium, meaning the ETF trades at a higher price than the calculated NAV. Conversely, a negative percentage indicates a discount, suggesting the ETF trades at a lower price than NAV.
SPXS shares are issued by Rafferty Asset Management LLC
SPXS follows the S&P 500. ETFs usually track some benchmark seeking to replicate its performance and guide asset selection and objectives.
The fund started trading on Nov 5, 2008.
The fund's management style is passive, meaning it's aiming to replicate the performance of the underlying index by holding assets in the same proportions as the index. The goal is to match the index's returns.