SPXS – Hedge Against Downturn Turned BullishChart Details
Price on Daily broke out of banana pattern.
Bullish EMA cross on Daily should occur with Daily close over $12.81
Weekly trend very close to bullish flip. When this occurs, $14 conservative price target.
10WeekMA cross around $13.50 should continue to fill gap at $15.
Opinion
We are long overdue for a pullback. Coronavirus now in 4 countries. Hong Kong on lock-down.
Gold and Silver looking bullish as well.
Next week 1/27 is going to be the biggest week of earnings. BA, AAPL, MCD, etc.
If AAPL misses earnings, there will be repercussions due to market cap of the company and being overpriced.
About Me
www.moneypatterns.com
Options Strategies, Video Technical Analysis, Instant Alerts, Specific Options Order Entry Details, Daily Updates, Equities & Crypto, Weekly Breakdowns, Charting Service, & More in Members Area!
Thank you for liking, commenting, throwing up a chart, following, or viewing.
I am not a financial advisor. My comments and reviews are based on what I do with my personal accounts and on www.moneypatterns.com
SPXS trade ideas

SPXS – Bullish Breakout – Any Day Now… Trade Entry
Anything at $12.80 or below is a great entry price as hedge.
I am putting some wishful orders in the $12.34 area and below just in case.
Chart Details
Banana pattern almost at end. I think the last Daily Bullish candle gave us a better contact point with $12.59 low.
The current downtrend without significant uptrend has occurred over 3 months. Overdue.
Gaps to fill up to $17.40.
Bullish EMA Cross and price crossing 10WeekMA will confirm uptrend.
About Me
Thank you for liking, commenting, throwing up a chart, following, or viewing.
I am not a financial advisor. My comments and reviews are based on what I do with my personal accounts.
Website will be ready for launch mid-January 2020.
Disclosure - I am long BTCUSD, GBTC. Short term GDX Bullish, SPXS Bullish, MCD Bullish

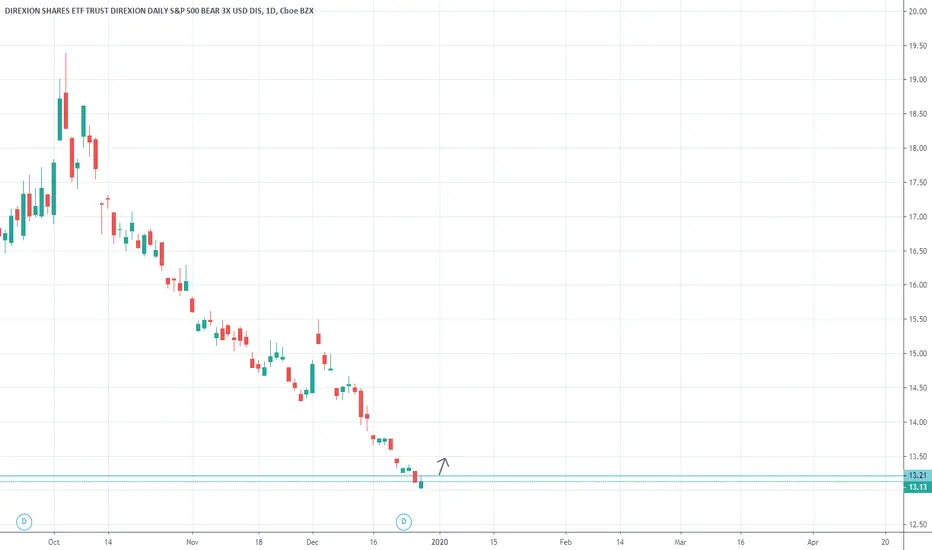
SPXS - Banana Pattern Getting BullishTRADING ACTIVE
Options were closed when stops were hit.
Stock is kept as better entry. More resistant to market whipsaw (no time issue like options).
Chart Details
Banana/Shoe pattern is repeating.
We are at the end of current pattern. Expecting gap fills up to possibly $17+
Bullish EMA Cross (at $13.70) and Bullish 10WeekMA cross ($14.60). Over both we are confirmed Bullish. I would be watching exits as this moves quick.
Fractal shown is from similar pattern where Daily candle had topping tail wick, followed by larger green Daily candle on next day.
This indicates the turn to me.
Entry Options
I would continue to add in this position under $12.90 if we get into end of pattern. Otherwise I am waiting with current position.
Stop loss at $12.70 – although I will probably hold past this. SPXS will pop and cover up-gaps.
Side-note - GDX and Gold are both turning bullish which (to me) is a secondary confirmation of incoming market correction/pullback.
News: - I haven't watched either but RealVision is excellent with sources.
1/1/2020 - John Bollinger Interview (Debunking False Assumptions) www.youtube.com
1/2/2020 - RealVision Finance "WTF is going on in the economy" www.youtube.com
About Me
Thank you for liking, commenting, throwing up a chart, following, or viewing.
I am not a financial advisor. My comments and reviews are based on what I do with my personal accounts.
I am transitioning to my new website www.moneypatterns.com and have updated my name previously jbird7839. Same guy - new name. :)
Website will be ready for launch mid-January 2020. Thank you for your patience while I try to juggle everything and maintain the same standards.
Disclosure - I am long BTCUSD, GBTC. Short term GDX Bullish, SPXS Bullish

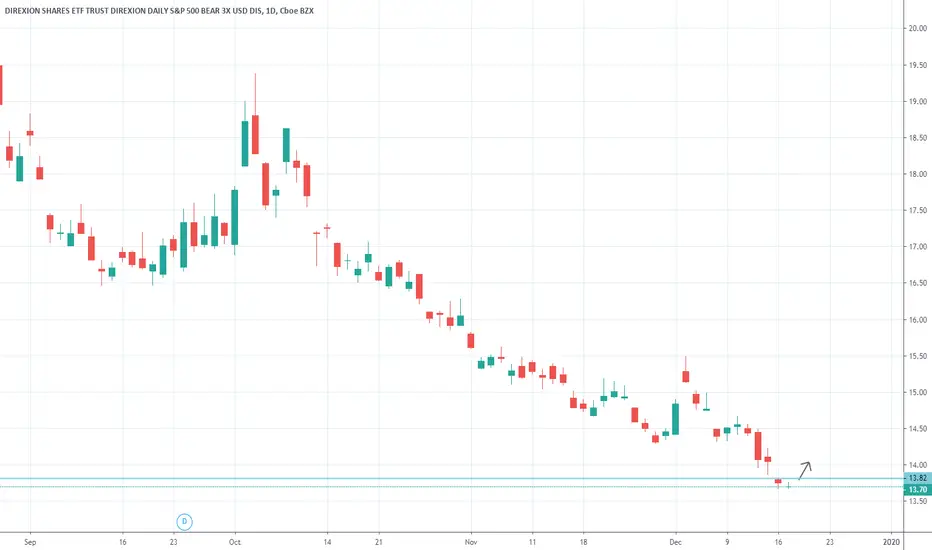
SPXS – Few Days Chop Before Bullish BreakoutTrading active in SPXS. Entry at $13.10 or less is great entry for 1 month hold max.
Trade Entry
I recommend using Dollar Cost Averaging to scatter orders under the $13.10 mark.
Chart Details
SPXS fractal holding from previous chart.
Fractal shows we will have few days chop sideways before pattern breakout.
Last fractal did not fill pattern, so I expect we do not get down into the $12.75 area.
Many gaps to fill going up to $17.
Price break of 13.66 confirms EMA bullish cross.
Price break of $14.31 confirms SPY should start pullback/correction.
About Me
Thank you for liking, commenting, throwing up a chart, following, or viewing.
I am not a financial advisor. My comments and reviews are based on what I do with my personal accounts.
Website will be ready for launch mid-January 2020. Thank you for your patience while I try to juggle everything and maintain the same standards.
Disclosure - I am long BTCUSD, GBTC. Short term GDX Bullish, SPXS Bullish, CRWD Bullish short term.
Previous SPXS Chart

SPXS - Bullish Confirmation on Daily YesterdayTRADING ACTIVE IN SPXS
Chart Details
SPXS confirmed Buy Signal on Daily yesterday.
Gaps to fill up to $17.50.
Bullish EMA cross will occur around $13.94.
10WeekMA cross around $14.60.
Anything above $14.60 should confirm Bullish trend up to gap fills.
Price may stop at each gap fill – watch to exit if reversal occurs.
RSI turned Bullish.
Trend Dots confirm Bullish trend on Daily. I will update if Weekly view also confirms.
Entry Options
I am entered in the Jan 17. Expiry, 12/17 Put Credit Spread. $3.83 Credit received. Breakeven SPXS at $13.17. Max loss $117. Max gain $3.83
About Me
Thank you for liking, commenting, throwing up a chart, following, or viewing.
I am not a financial advisor. My comments and reviews are based on what I do with my personal accounts.
I am transitioning to my new website www.moneypatterns.com and will be updating my username here. Same guy - new name. :)
Website will be ready for launch mid-January 2020. Thank you for your patience while I try to juggle everything and maintain the same standards.
Disclosure - I am long BTCUSD, GBTC.
Short term - GDX Bullish, SPXS Bullish, SMH Bearish

SPXS - Bearish SPY AlternativeI AM NOT ENTERED IN THIS TRADE
I will update on Monday 12/30.
Reading a chart from Unwind, he suggested to find a inverse SPY ETF. Credit to him for the suggestion.
I came across SPXS which is "3x inverse exposure to SP500 index" www.etf.com
This idea is meant for bearish bias on SPY, considering we are at ATH's and capital gains starts in January.
If you have same opinion of market conditions, let me know what you think or if you have an alternate idea.
Chart Details
Price above $13.94 confirms bullish EMA cross.
10WeekMA around $14.60 – re-analyze bullish trend continuation or exit below trade for profit.
Entry Options
- Jan. 17 expiry. 12/17 Put Credit Spread. Take in $3.90 Credit (as low as $3.80). Max loss at $3.80 is $120. Max loss at $3.90 credit is $110. Max gain possible is $390.
Exit at 50% profit or your risk tolerance. Must exit before expiry.
One leg of this spread is 92% POP. Other leg is only 5%. Total is over 85% POP.
About Me
Thank you for liking, commenting, throwing up a chart, following, or viewing.
I am not a financial advisor. My comments and reviews are based on what I do with my personal accounts.
I am transitioning to my new website www.moneypatterns.com and will be updating my username here. Same guy - new name. :)
Website will be ready for launch mid-January 2020. Thank you for your patience while I try to juggle everything and maintain the same standards.
Disclosure - I am long BTCUSD, GBTC.


1-2-3 HEAD SHOTs ONLY!!!Let's See....Observations & Vibrations...TBD!
Note : Psychological Dead-Loop: Do not ever let any position/decision be unrecoverable! As in "Ripping your Fookin Face Off"
"Risk is what we expect...Uncertianty is what we train for!" Shoot-Move-Commnicate!


Long SPXS for lower risk short play on the SPX - Big payoff!We have back to back reversal weeks and starting with the Sunday opening we will be reversing from the sloppy rally we had this week. With China trying to retaliate, I believe we get a sharp sell off. And risk is limited to the upside at least I cannot see this market breaking much higher than 2939 area of the ES this morning.

THE BIG SHORT! (LONG ON 3X BEAR SHARES)We all know that a recession is coming (even if we don't want to admit it). Buy once the RSI gives confirmation on the monthly chart.
EZ MONEY!


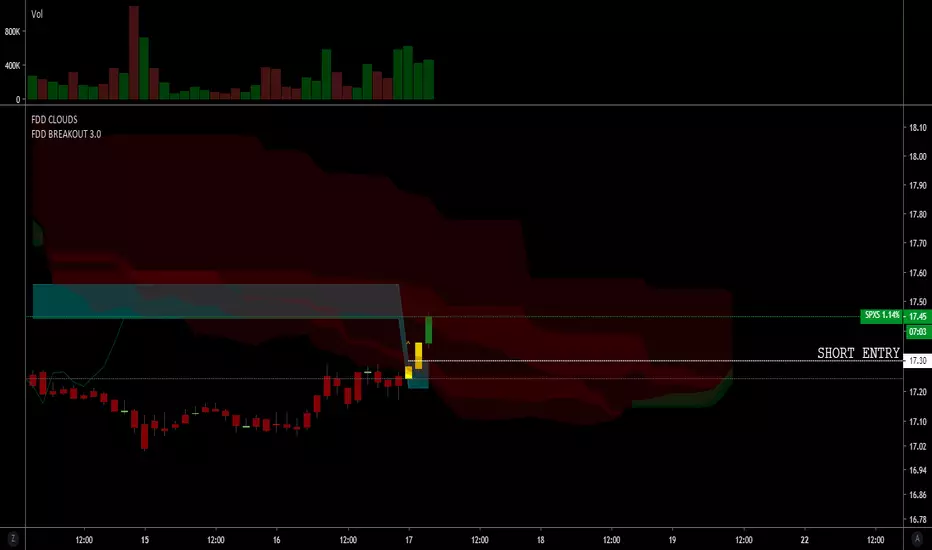
S&P Feels a bit overboughtTook this entry from the FDD breakout indicator. Lets see how it plays out.
S&P 500 1-day shortAccording to the Stock Trader's Almanac, today and tomorrow are "bear" days, when the S&P 500 has historically fallen more than 60% of the time.
Given how many stocks I've seen fall below supports and trendlines today, I can well believe that the indices will fall again tomorrow. I've taken a small position in the SPXS, a leveraged fund that delivers 3x the inverse of the S&P 500. I will sell tomorrow at the end of the day.

Market ReversalMarket stands to slow down coming into the summer months, amid various geopolitical tensions.

Low Risk entry on S&P ShortS&P Looking to retest highs. This will be the third attempted breakout above 3000. If it fails, I feel there's enough negative news to push stocks much lower.
May Jobs Report continues to disappoint (+75,000 jobs)
Continued trade wars intensify
Market hopeful of Fed Rate cut in July
Bond market pricing in 3 rate cuts in 2019

Short SPX 500 Next 2-4 WeeksClear sell-off in process. Looking for previous support levels to be reached.
In the next two weeks I see a pullback for SPXS right after SPX finds a brief bottom and consolidates for a short bit my target buy for SPXS is the 21’s and my Target sell is $25.
$29 SPXS coincides with ~2550 SPX. This is possible by Mid-July. (4 1/2 weeks).


